PulseCheck Journal
TL;DR
Disclaimer:
I wrote this TL;DR section at the very end, after completing the journal. Some of the conclusions mentioned here were not part of the original plan from the beginning. This project changed shape multiple times throughout development, and some decisions were made only after I had worked through later sub-iterations.
In case something feels inconsistent while reading the journal, that’s probably the reason.
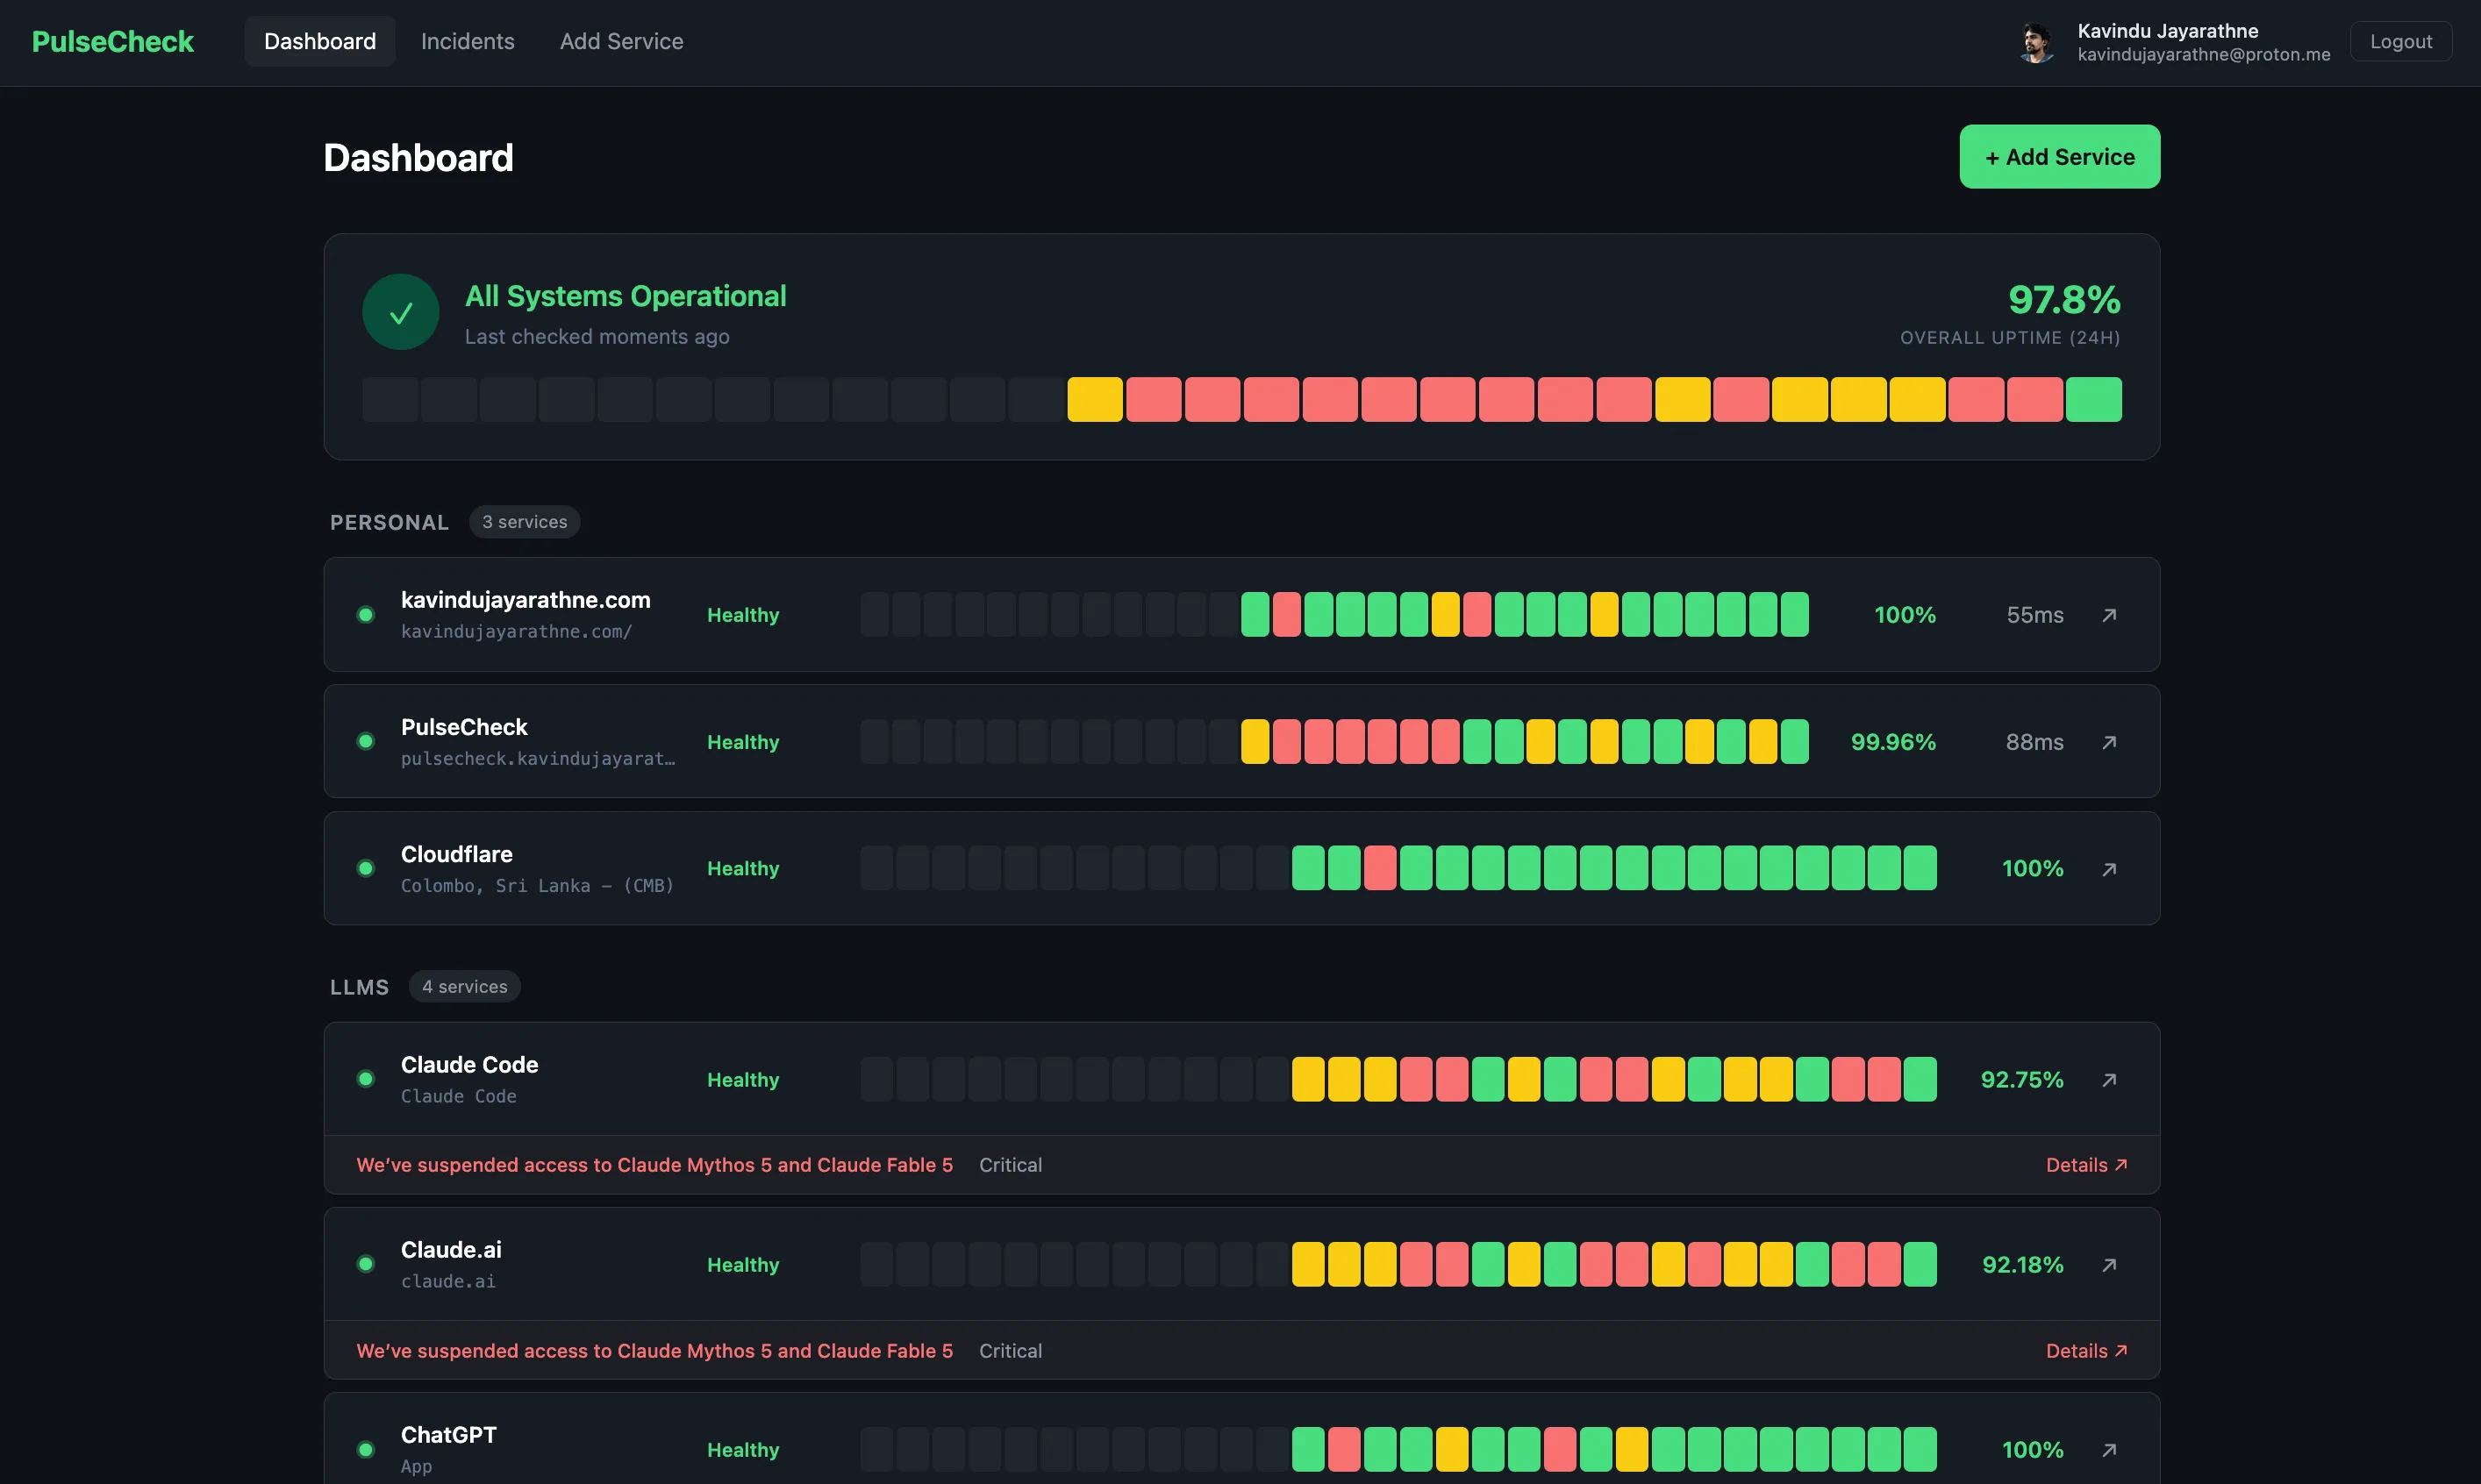
PulseCheck is a multi-user service monitoring dashboard. It periodically pings configured HTTP endpoints and records their health status, response time, and availability. For third-party services, it uses their official status page APIs, if supported, to monitor availability and display information about ongoing incidents, scheduled maintenance, and whatnot.
PulseCheck is a live service anyone can use for free, no strings attached. If you manage your own infrastructure like VPSes, self-host websites and services, or use third-party services and LLMs, PulseCheck is for you. Anything you want to keep an eye on for availability, you can monitor with PulseCheck from a single place.
Try out PulseCheck
PulseCheck Repository
On the other hand, I use PulseCheck as my permanent DevOps lab. The application runs through multiple layers: a dev layer with Docker Compose for development, a local production layer with K3d for pre-production testing, a real production layer with K3s on a VPS running a single-node cluster, and an additional four-node Kind cluster that I use as a playground for multi-node Kubernetes, security, and operational experiments.
For each layer, I have separate OAuth applications, so I can spin up all layers at once without any conflicts. That was the architecture I wanted.
Any experiments I do in the Kind layer stay local and do not affect production.
In the future, I might integrate PulseCheck with more advanced DevOps concepts. Production could grow into a multi-node deployment. I might integrate technologies such as Terraform, Jenkins, and more.
It’s a journey.
In short, PulseCheck is a reference environment.
Explanation:
“reference environment” — a stable, real deployment that I keep using as the foundation for ongoing experimentation. Not a project with a finish line. Not a sandbox that I throw away. A persistent, real environment that doubles as a lab.
The idea came from my virtual homelab. I already maintain a lab for security research, attack chains, defense, malware testing, and analysis. I keep documentation for the techniques I use in the lab. PulseCheck is the equivalent lab environment for DevOps.
I developed PulseCheck in iterations. You can check out each iteration and what was done during it in this journal.
PulseCheck Iteration 1
PulseCheck Iteration 2 - Coming Soon
Design
Disclaimer:
Things that come under this design section were part of my initial plan for the project. Some things might have changed as I moved forward with the project. In some parts, the design decisions and actual implementation might be different because this is a journal of the development process, not a documentation of the final state. Some ideas changed, some evolved, and some were replaced entirely as the project moved forward. For most of the changes, I mention them in the implementation section under each sub-iteration.
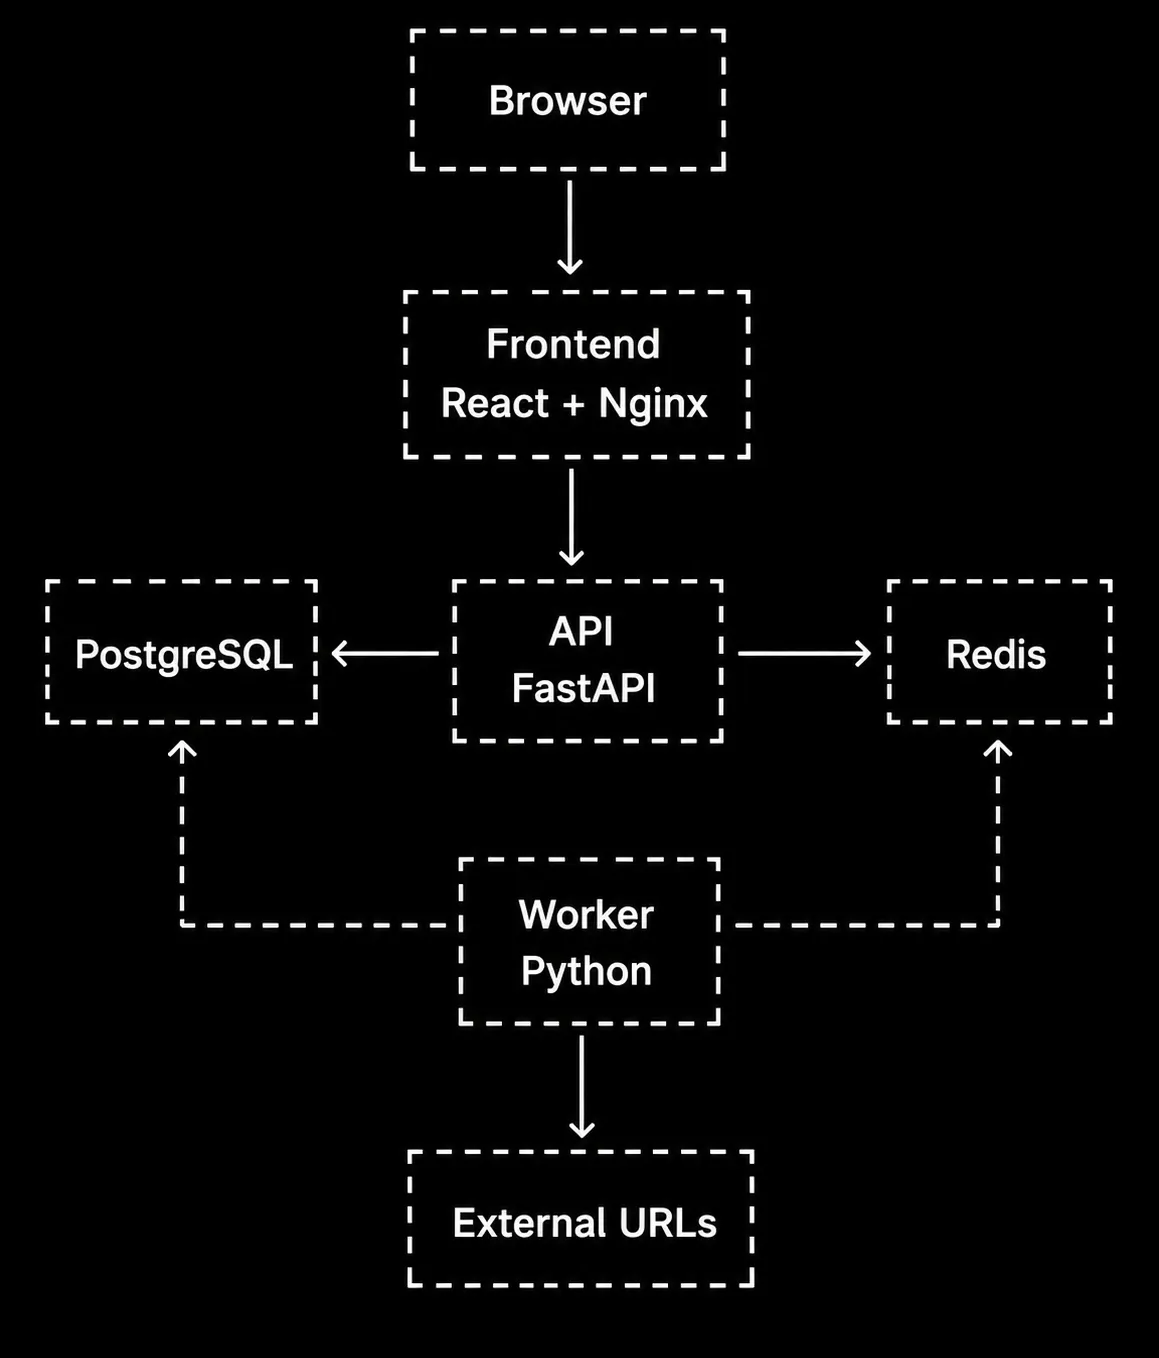
This diagram shows the basic flow of the application.
 Architecture
Diagram
Architecture
Diagram
Services
It’s a multi-service application, and each service runs in a separate Docker container.
| Service | Tech | Purpose |
|---|---|---|
| frontend | React + Vite + Nginx | Dashboard UI showing service status |
| api | Python FastAPI | REST endpoints for CRUD + serving data |
| worker | Python | Pings endpoints on intervals, records results |
| postgres | PostgreSQL (official image) | Stores services, check history, incidents |
| redis | Redis (official image) | Caches latest status per service |
Frontend (React + Vite + Nginx)
- Port: 3000 (dev), 80 (production via Nginx)
- Responsibility: Dashboard UI
- Talks to: API only
- Key views:
- Dashboard — all services grouped by category, live status, uptime %, latency, mini charts
- Service detail — response time chart (24h), uptime bar (30d), incident history
- Incidents — timeline of all incidents across services
- Add service — form with name, URL, category, interval, status page link, thresholds
API (Python FastAPI)
- Port: 8000
- Responsibility: REST API serving data to frontend, CRUD for services
- Talks to: PostgreSQL, Redis
- Auth: Google OAuth + GitHub OAuth
- Key endpoints:
GET /api/services— list current user’s monitored servicesPOST /api/services— add a service to monitorPUT /api/services/{id}— update a serviceDELETE /api/services/{id}— remove a serviceGET /api/services/{id}/checks— check history for a serviceGET /api/services/{id}— service detail with uptime statsGET /api/incidents— list all incidents for current user’s servicesGET /api/health— API health checkGET /api/auth/google— Google OAuth flowGET /api/auth/github— GitHub OAuth flow
Worker (Python)
- Responsibility: Background process that runs health checks
- Talks to: PostgreSQL, Redis, external URLs
- Behavior:
- Runs continuously, respecting each service’s individual check interval
- For each service, sends HTTP GET to the endpoint
- Records: status code, response time (ms), timestamp
- Determines status: “up” (expected status code + below degraded threshold), “degraded” (responding but slow), “down” (error/timeout/unexpected status)
- If status transitions (up -> down, up -> degraded, down -> up, degraded -> up): creates/resolves incident
- Caches latest status per service in Redis for fast dashboard loads
PostgreSQL
- Port: 5432
- Database schema:
users:
  id              UUID PRIMARY KEY
  email           VARCHAR UNIQUE NOT NULL
  name            VARCHAR NOT NULL
  auth_provider   VARCHAR NOT NULL        -- "google" or "github"
  created_at      TIMESTAMP

services:
  id                  UUID PRIMARY KEY
  user_id             UUID REFERENCES users(id)
  name                VARCHAR NOT NULL        -- "Claude API"
  url                 VARCHAR NOT NULL        -- "https://api.anthropic.com"
  category            VARCHAR                 -- "AI Tools" (user-defined, free text)
  check_interval      INTEGER DEFAULT 30      -- seconds
  status_page_url     VARCHAR                 -- "https://status.anthropic.com" (optional)
  expected_status     INTEGER DEFAULT 200     -- what status code means "up"
  timeout_ms          INTEGER DEFAULT 5000    -- after this, consider it down
  degraded_threshold_ms INTEGER DEFAULT 1000  -- above this = degraded
  created_at          TIMESTAMP

checks:
  id              UUID PRIMARY KEY
  service_id      UUID REFERENCES services(id)
  status_code     INTEGER                     -- HTTP status code (null if timeout)
  response_time   INTEGER                     -- milliseconds
  status          VARCHAR NOT NULL            -- "up", "down", "degraded"
  checked_at      TIMESTAMP

incidents:
  id              UUID PRIMARY KEY
  service_id      UUID REFERENCES services(id)
  type            VARCHAR NOT NULL            -- "downtime" or "degraded"
  started_at      TIMESTAMP NOT NULL
  resolved_at     TIMESTAMP                   -- null if ongoing
  checks_failed   INTEGER DEFAULT 0           -- consecutive failures count
Redis
- Port: 6379
- Stores:
- Latest status per service —
service:{id}:status-> JSON with current status, last check time, response time - Used for fast dashboard loads without hitting PostgreSQL for current status
- Latest status per service —
Other Tech Decisions
- Helm: Used from iteration 1 for K8s deployments
- CI/CD: GitHub Actions
- Local K8s: Kind for local cluster
- Production K8s: K3s on VPS
- Domain: It could be pulsecheck.kavindujayarathne.com, or I might use its own domain dedicated to this project. I haven’t decided yet (will finalize once the VPS is ready)
- Development: Everything containerized with Docker Compose plus volume mounts for hot reload
Commit Strategy -> Based on iterations
As I kept going with the idea, I realized that this kind of project can go far beyond just Docker and Kubernetes automation. There are a lot of DevOps concepts out there, and this project has the potential to slowly evolve into a full showcase of those.
But I can’t integrate everything at once. And that’s not the main purpose either. That’s one side of it.
The other thing is, I don’t want to just dump the code into GitHub with a single “Initial commit”. I want this project to feel more alive and descriptive than that.
So the best approach is to build this iteration by iteration. The first iteration focuses on deploying this as a working solution on a VPS, showcase my DevOps skills using Docker and Kubernetes automation, and handling the full deployment locally with kind, while using K3s on the VPS (in prod).
Each iteration is broken down into smaller sub-iterations. While working on the first main iteration, I complete each sub-iteration and commit it to GitHub. That’s always better than dumping the entire codebase with a single “Initial commit”.
Once the first main iteration is complete, I move on to the next one. Depending on the scope, each main iteration can also include multiple sub-iterations.
Multi-user model
Initial idea was to put this out as a single-user dashboard. That means I add all the services I want to monitor and deploy it. While it’s live, people can access it, but it only shows what I’ve added. Services that are useful to me and my infrastructure. No one can add services or do anything other than me. It’s basically my personal system monitoring dashboard out there, live.
At that point, there’s no real value for other people. So why even make it public? I’d rather keep it local and monitor my own services privately.
That changed my mind. I decided to make it a multi-user model, so anyone can make it their own personal dashboard by adding whatever they want to monitor and now it makes sence making it public.
Users can list all their services, and they can define their own categorization for the services they add. I’m not adding any predefined categories or anything. That’s up to each individual using it as their personal monitoring dashboard.
For authentication, I’m using Google OAuth and GitHub OAuth. It’s simple, and I don’t have to deal with handling security myself. I also thought about using magic links, but that would require setting up a mail service. So the easiest and cost-free option is OAuth, and I’ll stick with that.
Data Flow
1. Worker runs continuously
2. For each service, checks if it's time to ping (based on service's check_interval)
3. Sends HTTP GET to service URL (with configured timeout)
4. Determines status:
   - Response received + expected status code + response_time < degraded_threshold -> "up"
   - Response received + expected status code + response_time >= degraded_threshold -> "degraded"
   - Error / timeout / unexpected status code -> "down"
5. Writes check result to PostgreSQL
6. Updates latest status in Redis
7. Compares with previous status:
   - up -> down: create "downtime" incident
   - up -> degraded: create "degraded" incident
   - down/degraded -> up: resolve open incident
8. Frontend loads dashboard
9. API reads latest status from Redis (fast) + historical data from PostgreSQL on demand
10. Frontend renders dashboard grouped by user-defined categories
Docker Compose and Kubernetes
We don’t need Kubernetes for this project. Docker Compose alone would be enough on VPS. But because of the shape of this entire work as a DevOps playground and experimental environement, I thought I would run a single-node Kubernetes cluster on a VPS with K3s.
All local development happens with Docker Compose. Once the app is ready to be deployed, I use Kind locally to test the Kubernetes setup, then deploy it to the single-node Kubernetes cluster (K3s) running on my VPS.
Network (Docker Compose)
All services share a single Docker network (pulsecheck-net). Services reference each other by
container name:
- API connects to
postgres:5432andredis:6379 - Worker connects to
postgres:5432andredis:6379 - Frontend proxies API requests to
api:8000
Network (kubernetes)
I do not predefine the network part for Kubernetes yet. The main network segmentation logic is the same, but the way of defining it could be different because Docker Compose and Kubernetes are two different container orchestration types. I’m gonna handle this later with another sub-iteration when I test the Kubernetes environment locally with Kind.
Development approach
All development happens in containers. Nothing is installed on the host. Docker Compose with volume
mounts gives hot reload. All code changes reflect instantly without rebuilding images. Anyone can
clone the repo and run docker compose up without installing language runtimes.
Deployment path
Local-first, then production:
- Local development: Docker Compose
- Local Kubernetes: Kind cluster
- Production Kubernetes: K3s on a VPS
- Domain: pulsecheck.kavindujayarathne.com
- CI/CD: GitHub Actions first (lives in the repo, no extra server).
- Helm charts: Introduced from Sub-Iteration 10, used for all K8s deployments
Frontend pages (designed upfront)
- Login page — Google + GitHub OAuth buttons
- Dashboard — services grouped by category, status dots, uptime %, latency, mini response time charts, “X of Y operational” summary, recent incidents
- Service detail — response time chart (24h/7d/30d), uptime bar (30d), incident history
- Incidents page — timeline across all services, filterable by service/type/status
- Add/edit service form — name, URL, category, interval, thresholds, status page link
Redis usage (designed upfront)
Key pattern: service:{id}:status -> JSON with current status, last check time, response time. Purpose: fast dashboard loads without querying PostgreSQL for current state every time.
Implementation
There are three valid approaches. I can select one of them to move forward with the implementation.
The first one is the backend-first approach. Here, I finish the backend side first and then move to the UI at the end.
The second one is the frontend-first approach. Here, I build the UI against mocked data and then wire the real backend behind it.
The third approach is called vertical slices (Agile style). Here, what happens is I pick one feature at a time and build it top to bottom. As an example, I can simply take the “user can add a service” feature and do the DB + API + UI for just that feature. Then we can move to the next feature likewise.
I’m going with first one, which is the backend-first and then UI approach.
Main Iteration 1: Core App + Docker/Kubernetes Automation
Sub-Iteration 1: Project Structure with Docker Compose Setup
In this sub-iteration, I completed all five containers running locally via Docker Compose with placeholder code.
Completed tasks under 1st sub-iteration:
- Project structure (api/, worker/, frontend/)
- API service placeholder (FastAPI with a single health check endpoint at /api/health)
- Worker service placeholder (Python loop that sleeps and prints a waiting message)
- Frontend placeholder (React app that fetches the API health endpoint and displays its status)
- Dockerfile for api (python:3.12-slim, uvicorn with reload for development)
- Dockerfile for worker (python:3.12-slim)
- Dockerfile for frontend (node:20-alpine, Vite dev server)
- .dockerignore for api, worker, and frontend
- requirements.txt for api (fastapi, uvicorn, sqlalchemy, psycopg2-binary, redis, httpx, python-jose, authlib, alembic, python-dotenv, pydantic-settings)
- requirements.txt for worker (sqlalchemy, psycopg2-binary, redis, httpx, python-dotenv)
- package.json for frontend (react, react-dom, react-router-dom, axios, vite, @vitejs/plugin-react)
- docker-compose.yml with all five services wired together
- PostgreSQL service (official postgres:16-alpine image) with named volume for persistence
- Redis service (official redis:7-alpine image)
- Shared bridge network (pulsecheck-net) for all services
- Health checks for postgres, redis, and api
- Volume mounts on api, worker, and frontend for hot reload during development
- Environment variables passed through from .env file
- depends_on with condition: service_healthy for correct startup order
- .env.example with all required variables
- .env (local, excluded via .gitignore)
- .gitignore
- README with architecture, tech stack, quick start, and project layout
- MIT LICENSE
Sub-Iteration 2: Network Segmentation in Docker Compose
In the design section, I had defined a flat network. All 5 containers
were on a single Docker bridge network (pulsecheck-net). Every container could communicate with
every other container. Network segmentation was not part of the initial design, but I identified it
as a needed improvement later.
Having a flat network during local development is not a bad thing. It is easier sometimes. But having a segmented network is better because it is closer to the production build, and I can cut down some unnecessary interactions between containers.
As an example:
- The frontend container has no business touching the database
- The frontend container has no business touching Redis
Likewise, these cases are unnecessary interactions.
So I decided to segment the network properly.
Network segmentation rules:
- Public-facing: frontend, api
- Internal only: worker, postgres, redis
- Rules:
- Frontend can reach api only
- Api can reach postgres and redis
- Worker can reach postgres and redis, and can reach external URLs on the internet
- Postgres and Redis do not initiate outbound traffic and are not reachable from anything public
- Frontend cannot reach postgres, redis, or worker directly
Implementation of network segmentation:
I added two networks: web and data. Both frontend and api are attached to the web network.
Both have host port mappings in development. Api, worker, postgres, and redis are attached to the
data network. Internal communication happens by container name. Postgres and Redis have no port
mappings.
Container names resolve via Docker’s embedded DNS:
- Api connects to
postgres:5432andredis:6379 - Worker connects to
postgres:5432andredis:6379 - Frontend is not required to reach any other container directly during development (the browser calls the api via the host port)
Completed tasks under 2nd sub-iteration:
- Replace the single pulsecheck-net network with two networks: web and data
- Frontend attached to the web network only
- Api attached to both web and data networks (web for host port mapping in dev and future Nginx proxy, data for database and redis access)
- Worker attached to the data network only
- Postgres attached to the data network only
- Redis attached to the data network only
- Port mappings removed from postgres and redis so they are no longer reachable from the host
- Verify from inside the frontend container that postgres:5432 and redis:6379 are unreachable by name
- Verify from inside the api container that postgres:5432 and redis:6379 are still reachable
- Verify from inside the worker container that postgres, redis, and external URLs are reachable
Sub-Iteration 3: Database Schema and Migrations
Migration doesn’t mean moving data between databases here. It means changing the structure of the database in some sort of way.
Like:
- Adding a table is a migration
- Adding a column to the database is a migration
- Renaming a column is also a migration
Only the structure evolves while keeping the data as is.
In this sub-iteration, I used SQLAlchemy as the ORM (Object-Relational Mapper). It makes the Python code cleaner. The other thing that I used here was Alembic to make table creation automatic across every environment.
Sometimes, these tools have some trade-offs. As an example:
- ORMs could cause performance overhead
- Things could get messier with complex queries
So it requires dropping down to raw SQL when necessary.
Database Schema:
Changes from original schema on the design section to what I implemented:
- TIMESTAMP -> TIMESTAMP WITH TIME ZONE on all timestamp columns
- ON DELETE CASCADE added to all foreign keys (user_id, service_id)
- NOT NULL added to all foreign key columns (services.user_id, checks.service_id, incidents.service_id)
- NOT NULL DEFAULT now() added to created_at (users, services) and checked_at (checks)
- NOT NULL added to check_interval, expected_status, timeout_ms, degraded_threshold_ms, checks_failed
users:
  id              UUID PRIMARY KEY
  email           VARCHAR UNIQUE NOT NULL
  name            VARCHAR NOT NULL
  auth_provider   VARCHAR NOT NULL                      -- "google" or "github"
  created_at      TIMESTAMP WITH TIME ZONE NOT NULL DEFAULT now()

services:
  id                    UUID PRIMARY KEY
  user_id               UUID REFERENCES users(id) ON DELETE CASCADE NOT NULL
  name                  VARCHAR NOT NULL                -- "Claude API"
  url                   VARCHAR NOT NULL                -- "https://api.anthropic.com"
  category              VARCHAR                         -- "AI Tools" (user-defined, free text)
  check_interval        INTEGER NOT NULL DEFAULT 30     -- seconds
  status_page_url       VARCHAR                         -- "https://status.anthropic.com" (optional)
  expected_status       INTEGER NOT NULL DEFAULT 200    -- what status code means "up"
  timeout_ms            INTEGER NOT NULL DEFAULT 5000   -- after this, consider it down
  degraded_threshold_ms INTEGER NOT NULL DEFAULT 1000   -- above this = degraded
  created_at            TIMESTAMP WITH TIME ZONE NOT NULL DEFAULT now()

checks:
  id              UUID PRIMARY KEY
  service_id      UUID REFERENCES services(id) ON DELETE CASCADE NOT NULL
  status_code     INTEGER                               -- HTTP status code (null if timeout)
  response_time   INTEGER                               -- milliseconds
  status          VARCHAR NOT NULL                      -- "up", "down", "degraded"
  checked_at      TIMESTAMP WITH TIME ZONE NOT NULL DEFAULT now()

incidents:
  id              UUID PRIMARY KEY
  service_id      UUID REFERENCES services(id) ON DELETE CASCADE NOT NULL
  type            VARCHAR NOT NULL                      -- "downtime" or "degraded"
  started_at      TIMESTAMP WITH TIME ZONE NOT NULL
  resolved_at     TIMESTAMP WITH TIME ZONE              -- null if ongoing
  checks_failed   INTEGER NOT NULL DEFAULT 0            -- consecutive failures count
Completed tasks under 3rd sub-iteration:
- SQLAlchemy base configuration and session management module in shared db/ package at repo root
- Model for users (id, email, name, auth_provider, created_at)
- Model for services (id, user_id, name, url, category, check_interval, status_page_url, expected_status, timeout_ms, degraded_threshold_ms, created_at)
- Model for checks (id, service_id, status_code, response_time, status, checked_at)
- Model for incidents (id, service_id, type, started_at, resolved_at, checks_failed)
- Alembic initialized and configured to read DATABASE_URL from environment
- Initial migration creating all four tables with correct columns, types, defaults, and foreign keys
- Migrations run automatically on api container startup (entrypoint.sh runs alembic upgrade head before uvicorn)
- Database connection verified on startup with a clear error if it fails (api via FastAPI lifespan, worker via verify_db on startup)
- Shared database module reusable by worker (same models via root-level db/ package mounted into both containers)
- Build context for api and worker changed to repo root so Dockerfiles can COPY the shared db/ module
- Root-level .dockerignore created (replaces api/.dockerignore and worker/.dockerignore which no longer function with root build context)
- README updated with db/ in project structure
Sub-Iteration 4: OAuth authentication with GitHub and Google
I already mentioned that I’m using Google and GitHub OAuth for login in the PulseCheck application.
I took a few more decisions in this sub-iteration.
For token delivery and storage, I use HttpOnly cookie. I have already written an article about these cookie flags. If you are interested in that, check out the article.
With that:
- The browser handles token attachment automatically on every request
- The token is never accessible to JavaScript (XSS-proof)
- In production (Nginx proxy, same origin), it works out of the box with zero extra config
- The only downside (dual-port complexity in development) is solvable
I had a small issue when using HttpOnly cookie. In PulseCheck, the frontend and api run on separate ports during development. The React dev server runs on port 3000, and the FastAPI server runs on port 8000. They need separate ports because each has its own hot-reload server.
In production, Nginx serves both through one port, so this problem doesn’t exist. But in development, the browser sees two different origins, which makes cookie handling complicated.
I had two options to solve this.
I could either use loose cookie settings in development (SameSite=None, Secure=False) and
tighten them in production (SameSite=Lax, Secure=True), or configure a server.proxy rule in
vite.config.js so the Vite dev server proxies /api requests to http://api:8000, making the
browser see everything as same-origin.
With the second option, when the frontend calls /api/services, the Vite dev server intercepts it
and forwards it to http://api:8000/api/services behind the scenes. The browser only ever talks to
port 3000, so cookies work as if everything is on the same server.
I decided to go with the second option, which is using a dev proxy to solve the dual-port cookie problem.
It mirrors how production works (Nginx proxy), needs no environment-specific cookie config, and
removes the need for VITE_API_URL in development.
The next decision that I took was about JWT expiration.
I selected the (1h + 7d) option for PulseCheck.
Initially, I was about to select 24h. But users would have to log in every day. As someone who uses dozens of services, I know how disturbing it is to log in again and again within a short time period.
But with (1h + 7d), it covers both the security aspect and doesn’t require users to log in every
day at the same time.
In this way, login gets two tokens:
- Access token (1h) — used for API calls
- Refresh token (7d) — used only to get a new access token
The access token expires after 1h, after which the frontend automatically calls /api/auth/refresh
with the refresh token and gets a new access token (1h). The user doesn’t notice anything.
This keeps working until the refresh token expires (7 days). Then the user has to log in again.
In this way, if the access token somehow gets stolen, it is only valid for 1h. The refresh token is harder to steal because it is only sent on one specific endpoint. It is not sent on every API call. This is how it covers the security aspect.
When the cookie expires, it returns 401 Unauthorized when the frontend tries to call
/api/services, and then redirects the user to the login page.
Endpoints Structure
Endpoint structure was organized this way inside ./api.
- main.py — creates the app, includes routers
- auth.py — /api/auth/* (login, callback, logout, refresh, me)
- deps.py — shared functions used by multiple routers
- services.py — /api/services/* (Sub-Iteration 5)
- incidents.py — /api/incidents/* (Sub-Iteration 5)
Our initial design endpoints only showed these two related to auth:
GET /api/auth/googleGET /api/auth/github
This is the updated OAuth endpoint structure in this sub-iteration:
GET /api/auth/github— redirects the user to GitHub’s login pageGET /api/auth/github/callback— GitHub redirects here with the code, exchanges it, sets the cookie, and redirects to the frontendGET /api/auth/google— same patternGET /api/auth/google/callback— same patternPOST /api/auth/logout— clears the cookiePOST /api/auth/refresh— exchanges the refresh token for a new access token (called automatically by the frontend when the access token expires)GET /api/auth/me— returns current user info (the frontend needs this to know who is logged in)
Protected vs non-protected endpoints:
I built the protected route dependency for FastAPI that resolves the current user from the access token during this sub-iteration.
Protected endpoints require a logged-in user. Adding Depends(get_current_user) to an endpoint
makes it protected. Non-protected endpoints are accessible to anyone.
It works by reading the access_token cookie from the incoming request, decoding and verifying the JWT signature, looking up the user in the database, and passing the User object to the endpoint. If anything fails at any step (no cookie, invalid token, expired token, user not found), it rejects the request with a 401 Unauthorized response and the endpoint code never runs.
Non-protected:
/api/health— monitoring tools and health checks need to reach this without auth/api/auth/github,/api/auth/github/callback— cannot require login on the login flow itself/api/auth/google,/api/auth/google/callback— same reason/api/auth/logout— intentionally unprotected so that even a user with an expired token can cleanly log out instead of getting a 401 error/api/auth/refresh— needs to work when the access token has expired, which is the whole point of refreshing
Protected:
/api/auth/me— returns the current user’s info, only makes sense if someone is logged in- All service and incident endpoints (Sub-Iteration 5), they need user_id to scope queries, without knowing who is calling there is no way to return the right data
Completed tasks under 4th sub-iteration:
- JWT creation and verification module (deps.py with access/refresh token functions and get_current_user dependency)
- OAuth flow for GitHub (authorization redirect, callback, token exchange)
- OAuth flow for Google (authorization redirect, callback, token exchange)
- User lookup and creation on OAuth callback (get or create by email and provider)
- JWT access token (1h) and refresh token (7d) issued as HttpOnly cookies on successful login
- Protected route dependency for FastAPI that resolves the current user from the access token cookie
- Refresh endpoint to exchange refresh token for a new access token
- Logout endpoint that clears both cookies
- /api/auth/me endpoint to return current user info
- Auth router registered in FastAPI app (main.py)
- Dev proxy configured in vite.config.js (proxy /api requests to API container)
- Frontend uses relative URLs, so no VITE_API_URL needed in development
- FRONTEND_URL added to api environment in docker-compose.yml, .env, and .env.example
- SECRET_KEY placeholder in .env replaced with a real random string for JWT signing
- /api/auth/github and /api/auth/google endpoints fully functional
Sub-Iteration 5: API Endpoints for Services and Incidents
In this sub-iteration, I added schemas.py for request and response models, and handled the
services and incidents API endpoints with services.py and incidents.py.
- api/schemas.py — Pydantic schemas defining the shape of every request body and every response. FastAPI uses them to validate incoming JSON before any handler runs and to strip outgoing responses to exactly the declared shape, which doubles as a security boundary against accidentally leaking internal fields.
- api/services.py — Services router with the full CRUD surface (list, create, read, update, delete) plus discover/validate-url endpoints for the status-page flow. Every endpoint declares its request schema via the function parameter and its response schema via response_model, so the validation contract lives in the route signature itself.
- api/incidents.py — Incidents router exposing a filtered listing endpoint: scoped to the authenticated user’s services and optionally narrowed by service_id and time range.
main.py was modified to register the new routers.
Endpoints that delivered in this sub-iteration
| Method | Endpoint | Purpose |
|---|---|---|
| GET | /api/services | List current user’s services |
| POST | /api/services | Add a service |
| GET | /api/services/{id} | Service detail with 24h/7d/30d uptime stats |
| PUT | /api/services/{id} | Update a service (owner only) |
| DELETE | /api/services/{id} | Remove a service (owner only) |
| GET | /api/services/{id}/checks | Check history with pagination |
| GET | /api/incidents | List incidents, filterable by service_id, type, status |
Only users can modify their own data because all queries are scoped by user_id. I also tested
every endpoint with a real JWT token against the running containers.
All the endpoints that i created this far of PulseCheck
| Sub-Iteration | Method | Endpoint | Purpose |
|---|---|---|---|
| 1 | GET | /api/health | API health check |
| 4 | GET | /api/auth/github | Redirect to GitHub login |
| 4 | GET | /api/auth/github/callback | GitHub OAuth callback, sets JWT cookies |
| 4 | GET | /api/auth/google | Redirect to Google login |
| 4 | GET | /api/auth/google/callback | Google OAuth callback, sets JWT cookies |
| 4 | POST | /api/auth/logout | Clear auth cookies |
| 4 | POST | /api/auth/refresh | Exchange refresh token for new access token |
| 4 | GET | /api/auth/me | Return current user info |
| 5 | GET | /api/services | List current user’s services |
| 5 | POST | /api/services | Add a service |
| 5 | GET | /api/services/{id} | Service detail with 24h/7d/30d uptime stats |
| 5 | PUT | /api/services/{id} | Update a service (owner only) |
| 5 | DELETE | /api/services/{id} | Remove a service (owner only) |
| 5 | GET | /api/services/{id}/checks | Check history with pagination |
| 5 | GET | /api/incidents | List incidents, filterable by service_id, type, status |
Completed tasks under 5th sub-iteration:
- Pydantic schemas for request and response models
- GET /api/services (list current user’s services)
- POST /api/services (add a service, associated with current user)
- PUT /api/services/{id} (update a service, only if owned by current user)
- DELETE /api/services/{id} (remove a service, only if owned by current user)
- GET /api/services/{id} (service detail with uptime stats for 24h, 7d, 30d)
- GET /api/services/{id}/checks (check history for the service)
- GET /api/incidents (list incidents across current user’s services, filterable by service, type, and status)
- All queries scoped by user_id to enforce data isolation
Sub-Iteration 6: Worker Health Check Logic
In Sub-Iteration 6, I replaced the placeholder worker with real health check logic. The worker is a background process that continuously monitors all configured services, writing results to both PostgreSQL (for permanent history) and Redis (for fast dashboard reads). It handles the full lifecycle, detecting when services go down or become degraded, creating incidents on status transitions, tracking consecutive failures, and resolving incidents on recovery. This is the component that makes PulseCheck a real monitoring tool rather than just a CRUD app with a list of URLs.
Completed tasks under 6th sub-iteration:
- Load services from PostgreSQL on each scheduler tick
- For each service, check if it is time to ping based on check_interval and last checked time
- Send HTTP GET to the service URL using httpx with the configured timeout
- Measure response time in milliseconds
- Determine status as up, degraded, or down based on response and thresholds (expected_status, degraded_threshold_ms, timeout_ms)
- Write check result to the checks table (status_code, response_time, status, checked_at)
- Cache the latest status per service in Redis under service:{id}:status
- Compare new status with previous status stored in Redis
- Create an incident on status transitions from up to down or up to degraded
- Resolve an open incident on recovery from down or degraded to up
- Increment checks_failed on consecutive failures
Sub-Iteration 7: Frontend Dashboard and Pages
This is where the UI side of PulseCheck comes together. I structured all the main pages here: login, dashboard, service detail, incidents, and the add/edit service form. I also wired up the auth context, protected routes, and the shared layout. Tailwind CSS v4 and React Router v7 are the main pieces on the frontend stack.
Completed tasks under 7th sub-iteration:
- Tailwind CSS v4 integrated via @tailwindcss/vite plugin
- Frontend Dockerfile updated to node:22-alpine
- Vite config with React plugin, Tailwind plugin, and /api proxy to api container
- Centralized frontend organization: constants (colors.js, routes.js), assets/icons (StatusDot, GitHubIcon, GoogleIcon)
- React Router v7 setup with public and protected routes
- Login page with Google and GitHub OAuth buttons using icon components
- Auth context (AuthContext.jsx) with /auth/me check and loading state
- Protected route component redirecting unauthenticated users to login
- Axios instance (api.js) with auth interceptor (401 redirect, skips /auth/me and login page to prevent redirect loop)
- Layout component with navbar (Dashboard, Incidents, Add Service links, user name, logout)
- Dashboard view with services grouped by category, empty categories hidden
- Per service card (ServiceCard.jsx) with status dot, uptime percentage, current latency, and link to official status page
- SafeLink component for XSS-safe external links (only allows http/https protocols)
- Overall status summary bar (X of Y services operational)
- 30-day uptime bar on each service card (UptimeBar.jsx with per-day status from API)
- API endpoint updated to return per-day uptime data for the 30-day bar
- Active incidents section on the dashboard
- Service detail page with response time chart (24h/7d/30d toggle via recharts), uptime percentages (24h/7d/30d), incident history table, status page link
- Incidents page with timeline filterable by service, type (downtime/degraded), and status (open/resolved)
- Add service form with URL validation (checks http/https protocol before submit)
- Edit and delete service actions on service detail page
- Favicon (green circle SVG matching accent color)
- Login page redesign: branded logo, welcome card, Google/GitHub auth buttons, feature list, footer
- Dashboard redesign: row-based service layout, overall status summary with uptime bar, category grouping with count badges
- Centralized color system via Tailwind v4 @theme. All colors defined once in index.css, no hardcoded hex values in components
- colors.js mirrors theme values for JS-only usage (recharts, dynamic inline styles)
- User avatar and email displayed in navbar (avatar_url captured from GitHub/Google OAuth)
- Database migration: avatar_url column added to users table
Sub-Iteration 8: Improve Monitoring Capabilities
This is an additional iteration. I hit a wall in the previous iteration. I encountered several issues that I didn’t realize at the beginning.
-
First, I was about to monitor LLMs as well as my personal infrastructure. But that’s complex. I cannot just ping
https://chatgpt.comorhttps://claude.aiand check whether those models are up, down, degraded, or something. I have to synthetically ping the API endpoints for that, and that costs tokens. -
Second, even for normal HTTP pings, most websites have bot protection. Websites with bot protection return
403status codes, so we cannot monitor most websites with simple HTTP pings.
Thus, I had to use some strategies to make this useful. Even though this project doubles as my permanent lab environment for DevOps practices, from the beginning, I wanted to build something useful alongside that goal.
In the 8th sub-iteration, I tried to solve some of those limitations.
I found something interesting. Most official status pages for different services use the same underlying mechanism or status page provider to host their status pages. I don’t have an exact idea where it originally comes from, but I found some publicly exposed endpoints related to those status pages that provide monitoring status information about those services.
This does not support every service’s status page, but most major ones support those API endpoints.
I added a new monitoring type called status page. With this monitoring type, I used those API
endpoints to fetch monitoring information about services. Even the official status pages themselves
are backed by this data. I can get all the updates immediately with zero waiting time, so I don’t
have to probe LLMs and similar services just to figure out their status.
Common endpoints that I found:
/api/v2/summary.json/api/v2/components.json/api/v2/incidents.json
summary.json contains all the available information. We can jump into each section separately by
calling the other endpoints individually.
I used these endpoints to fully handle this part of the project. This is how I gave it actual value.
Now, for users’ own infrastructure, such as things hosted on self-managed servers (VPSes) and
personal infrastructure, they can use HTTP pings. For third-party platforms that users rely on
daily, such as Claude, ChatGPT, and the components related to those services, they can monitor them
with the status page monitoring type using the public endpoints mentioned above.
It took me a considerable amount of time to research and finish this part because it involved a lot of work..
Completed tasks under 8th sub-iteration:
- Database migration adds monitor_type, status_page_api_urls, component_name columns to services. services.url made nullable
- Database migration adds user_defined_urls column for the manual URL fallback path
- SQLAlchemy Service model updated with monitor_type, status_page_api_urls, user_defined_urls, component_name fields
- Adaptive parser in repo-root parsers/ with single ParsedStatusPage / ParsedComponent / ParsedIncident / ParsedScheduledMaintenance shape, no vendor branching
- Status normalization (operational, degraded_performance, partial_outage, major_outage, under_maintenance) into up, degraded, down
- parsers/discover.py with flat ENDPOINTS list of (path, role) tuples for one-line extensibility
- Source-of-truth split: components from components.json, incidents and scheduled maintenances from summary.json
- parsers/summary.py merge() unions components with dedup by (group_name, name) as a safety net for multi-URL overlap
- parse_user_url helper for the validate-url path
- API endpoint POST /api/services/discover probes the standard endpoints and returns api_urls plus components
- API endpoint POST /api/services/validate-url accepts an array of user URLs and keeps only those that contributed components, incidents, or scheduled maintenances
- ServiceCreate schema accepts user_defined_urls and validates that either status_page_api_urls or user_defined_urls is populated alongside component_name
- _serialize_service decodes the JSON-encoded URL columns before Pydantic validation
- Strict component-scoped match for active incidents in the worker. Entries with no affected_components or with a non-matching component are dropped
- ParsedScheduledMaintenance carries affected_components extracted from the maintenance components array
- Strict component-scoped match for scheduled maintenances in the worker
- Worker batches services by URL tuple, throttled per cycle via Redis
- Worker resolves urls as status_page_api_urls or user_defined_urls (standard primary, user_defined fallback)
- ServiceCard and ServiceDetail render active incident and scheduled maintenance banners from the Redis cache
- Frontend ServiceForm: HTTP Ping / Status Page toggle, paste-URL Discover flow, optgroup-grouped component picker
- Frontend ServiceForm conditional manual URL section, revealed only after Discover returns no components, with add-another-URL and per-row remove, single Validate button
- xor enforced at the form layer: status_page_api_urls saved on the discover path, user_defined_urls saved on the manual path, never both
- Dashboard ServiceCard and ServiceDetail handle both monitor types, no latency placeholder or chart for status page services
- Frontend axios interceptor calls /api/auth/refresh on 401 and retries the original request
- Dashboard and ServiceDetail poll every 20s with cancelled-flag cleanup
- Responsive polish: hamburger menu below md, mobile two-row ServiceCard, smaller UptimeBar on mobile, flex-wrap on filters, overflow-x-auto on incident table consolidated palette
Sub-Iteration 9: Production-ready Docker Setup
The next iteration is about deploying this with Kind (local Kubernetes). That’s a production simulation that I handle locally. This sub-iteration was about getting things ready for that.
Before deploying, production Docker hardening is a must. So I wanted to create different stages in the Dockerfiles.
I used multi-stage Dockerfiles for /frontend, /api, and /worker, which is a Docker build
technique where a single Dockerfile uses multiple isolated build stages. So the final image only
includes what’s necessary for production.
Changed files:
./frontend/Dockerfile
# Dev stage — Vite dev server with hot reload
FROM node:22-alpine AS dev
WORKDIR /app
COPY package*.json ./
RUN npm install
COPY . .
EXPOSE 3000
CMD ["npm", "run", "dev"]

# Builder stage — produces dist/ for production
FROM node:22-alpine AS builder
WORKDIR /app
COPY package*.json ./
RUN npm ci
COPY . .
RUN npm run build

# Prod stage — Nginx serving static files
FROM nginx:alpine AS prod
RUN apk add --no-cache curl
COPY --from=builder /app/dist /usr/share/nginx/html
COPY nginx.conf /etc/nginx/conf.d/default.conf
EXPOSE 80
HEALTHCHECK --interval=30s --timeout=5s --retries=3 \
  CMD curl -f http://localhost/health || exit 1
CMD ["nginx", "-g", "daemon off;"]
./api/Dockerfile
# Builder stage — installs Python dependencies into an isolated user prefix
FROM python:3.12-slim AS builder
WORKDIR /app
COPY api/requirements.txt .
RUN pip install --no-cache-dir --user -r requirements.txt

# Dev stage — full image with reload, used by docker-compose.yml
FROM python:3.12-slim AS dev
RUN apt-get update && apt-get install -y --no-install-recommends curl && rm -rf /var/lib/apt/lists/*
COPY --from=builder /root/.local /root/.local
ENV PATH=/root/.local/bin:$PATH \
    PYTHONUNBUFFERED=1
WORKDIR /app
COPY db/ ./db/
COPY parsers/ ./parsers/
COPY api/ .
RUN chmod +x entrypoint.sh
EXPOSE 8000
CMD ["./entrypoint.sh", "uvicorn", "main:app", "--host", "0.0.0.0", "--port", "8000", "--reload"]

# Prod stage — same runtime, no reload
FROM python:3.12-slim AS prod
RUN apt-get update && apt-get install -y --no-install-recommends curl && rm -rf /var/lib/apt/lists/*
COPY --from=builder /root/.local /root/.local
ENV PATH=/root/.local/bin:$PATH \
    PYTHONUNBUFFERED=1
WORKDIR /app
COPY db/ ./db/
COPY parsers/ ./parsers/
COPY api/ .
RUN chmod +x entrypoint.sh
EXPOSE 8000
CMD ["./entrypoint.sh", "uvicorn", "main:app", "--host", "0.0.0.0", "--port", "8000"]
./worker/Dockerfile
# Builder stage — installs Python dependencies into an isolated user prefix
FROM python:3.12-slim AS builder
WORKDIR /app
COPY worker/requirements.txt .
RUN pip install --no-cache-dir --user -r requirements.txt

# Dev stage — used by docker-compose.yml with source mounts for hot reload
FROM python:3.12-slim AS dev
COPY --from=builder /root/.local /root/.local
ENV PATH=/root/.local/bin:$PATH \
    PYTHONUNBUFFERED=1
WORKDIR /app
COPY db/ ./db/
COPY parsers/ ./parsers/
COPY worker/ .
CMD ["python", "main.py"]

# Prod stage — same runtime, immutable image
FROM python:3.12-slim AS prod
COPY --from=builder /root/.local /root/.local
ENV PATH=/root/.local/bin:$PATH \
    PYTHONUNBUFFERED=1
WORKDIR /app
COPY db/ ./db/
COPY parsers/ ./parsers/
COPY worker/ .
CMD ["python", "main.py"]
docker-compose.yml
services:
  postgres:
    image: postgres:16-alpine
    container_name: pulsecheck-postgres
    environment:
      POSTGRES_USER: ${POSTGRES_USER}
      POSTGRES_PASSWORD: ${POSTGRES_PASSWORD}
      POSTGRES_DB: ${POSTGRES_DB}
    volumes:
      - postgres-data:/var/lib/postgresql/data
    networks:
      - data
    healthcheck:
      test: ["CMD-SHELL", "pg_isready -U ${POSTGRES_USER} -d ${POSTGRES_DB}"]
      interval: 10s
      timeout: 5s
      retries: 5
    restart: unless-stopped

  redis:
    image: redis:7-alpine
    container_name: pulsecheck-redis
    networks:
      - data
    healthcheck:
      test: ["CMD", "redis-cli", "ping"]
      interval: 10s
      timeout: 5s
      retries: 5
    restart: unless-stopped

  api:
    build:
      context: .
      dockerfile: api/Dockerfile
      target: dev
    container_name: pulsecheck-api
    ports:
      - "8000:8000"
    volumes:
      - ./api:/app
      - ./db:/app/db
      - ./parsers:/app/parsers
    environment:
      DATABASE_URL: ${DATABASE_URL}
      REDIS_URL: ${REDIS_URL}
      SECRET_KEY: ${SECRET_KEY}
      GOOGLE_CLIENT_ID: ${GOOGLE_CLIENT_ID}
      GOOGLE_CLIENT_SECRET: ${GOOGLE_CLIENT_SECRET}
      GITHUB_CLIENT_ID: ${GITHUB_CLIENT_ID}
      GITHUB_CLIENT_SECRET: ${GITHUB_CLIENT_SECRET}
      OAUTH_REDIRECT_BASE_URL: ${OAUTH_REDIRECT_BASE_URL}
      FRONTEND_URL: ${FRONTEND_URL}
    networks:
      - web
      - data
    depends_on:
      postgres:
        condition: service_healthy
      redis:
        condition: service_healthy
    healthcheck:
      test: ["CMD", "curl", "-f", "http://localhost:8000/api/health"]
      interval: 10s
      timeout: 5s
      retries: 5
      start_period: 10s
    restart: unless-stopped

  worker:
    build:
      context: .
      dockerfile: worker/Dockerfile
      target: dev
    container_name: pulsecheck-worker
    volumes:
      - ./worker:/app
      - ./db:/app/db
      - ./parsers:/app/parsers
    environment:
      DATABASE_URL: ${DATABASE_URL}
      REDIS_URL: ${REDIS_URL}
    networks:
      - data
    depends_on:
      postgres:
        condition: service_healthy
      redis:
        condition: service_healthy
    restart: unless-stopped

  frontend:
    build:
      context: ./frontend
      dockerfile: Dockerfile
      target: dev
    container_name: pulsecheck-frontend
    ports:
      - "3000:3000"
    volumes:
      - ./frontend/src:/app/src
    networks:
      - web
    depends_on:
      api:
        condition: service_healthy
    restart: unless-stopped

volumes:
  postgres-data:

networks:
  web:
    driver: bridge
  data:
    driver: bridge
docker-compose.prod.yml
services:
  api:
    build:
      target: prod
    ports: !reset []
    volumes: !reset []

  worker:
    build:
      target: prod
    volumes: !reset []

  frontend:
    build:
      target: prod
    ports: !override
      - "80:80"
    volumes: !reset []
    healthcheck:
      test: ["CMD", "curl", "-f", "http://localhost/health"]
      interval: 30s
      timeout: 5s
      retries: 3
      start_period: 10s
Completed tasks under 9th sub-iteration:
- Multi-stage Dockerfile for frontend (build stage producing static files, runtime stage serving via Nginx)
- Multi-stage Dockerfile for api producing a smaller runtime image without build tools
- Multi-stage Dockerfile for worker matching the api pattern
- frontend/nginx.conf with /api reverse proxy to the api container and a /health endpoint
- Health check added for frontend (Nginx based)
- api/entrypoint.sh updated to exec passed args so dev and prod targets can pass different uvicorn flags
- docker-compose.prod.yml override using !reset and !override tags so dev mounts and ports are actually cleared in prod
- Verified production stack runs locally via
docker compose -f docker-compose.yml -f docker-compose.prod.yml up
Sub-Iteration 10: Local Kubernetes Deployment via kind (multi-node showcase)
This is an important stage. From the beginning until the 9th sub-iteration, I kept saying that my idea was to use Kind as the local production layer that I use to test the real production deployment locally before PulseCheck gets deployed there.
But as I worked through the 10th sub-iteration, I started to feel like I was going a bit off track with that idea. The real production environment is supposed to run on a single-node cluster. But here, with Kind, I was practicing on a four-node cluster.
I was playing with a more advanced setup with HPA, multi-node scheduling, and a lot more than the real production environment. Real production has a different shape because it is a single-node cluster, and that is fundamentally different from a multi-node cluster.
I had to change my plan immediately. It became obvious that this sub-iteration with kind did not fit as the local production testing layer. A local production testing layer should be something much closer to the real production environment. Instead, I decided to make this the experimental layer.
I decided to deploy PulseCheck with multiple layers. I develop PulseCheck with Docker Compose. That is the development layer.
Then there are multiple cluster environments ahead.
The Kind cluster is the experimental layer, which I mostly use for lab purposes. I run a local production layer on a single-node cluster to test application deployments before PulseCheck gets deployed to the real production environment with K3s. For that local production layer, I use K3d, which is the containerized version of K3s.
Finally, the real production layer runs on a single-node K3s cluster hosted on a VPS.
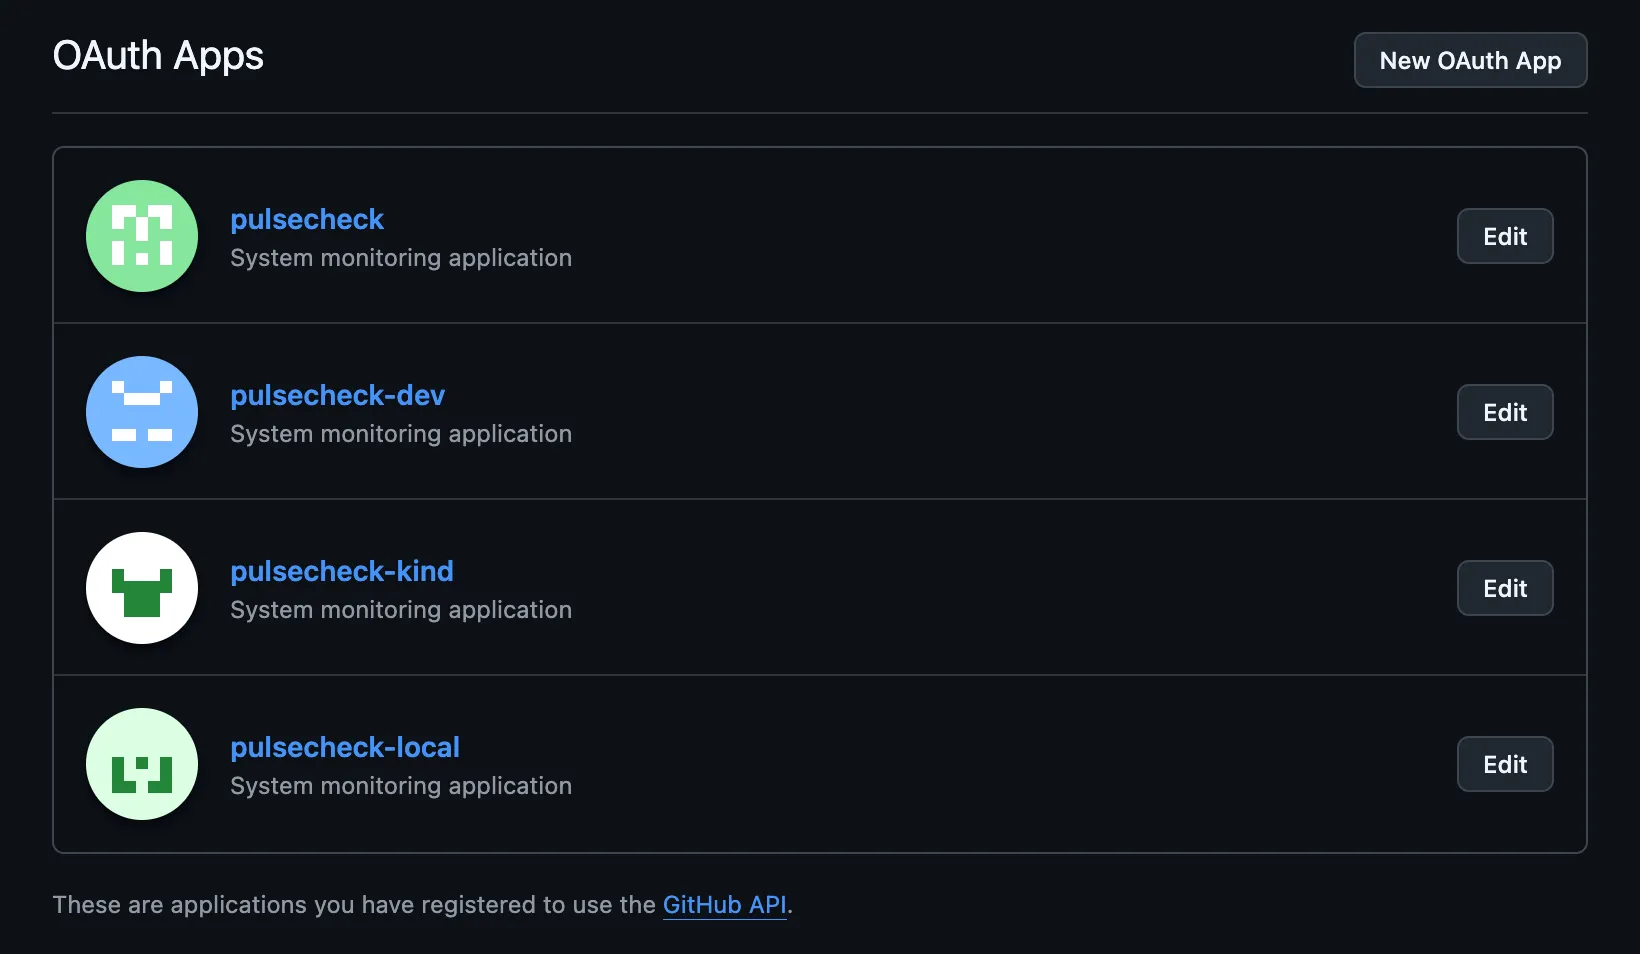
I programmed PulseCheck to run on all three Kubernetes environments (Kind, K3d, and K3s) simultaneously without any conflicts. It has separate GitHub and Google OAuth applications for each layer, including the Docker Compose development layer.
 GitHub
OAuth Applications
GitHub
OAuth Applications
So from this point forward, both the 10th and 11th sub-iterations are about the Kind layer. This is where I talk about how I handled and experimented with a multi-node Kubernetes cluster locally.
Up to this point, I was using Docker Compose. This is where PulseCheck starts running on a Kind cluster with Helm charts.
One thing worth mentioning before jumping into the cluster itself is that I use the same Helm chart across all Kubernetes layers. Kind, K3d, and K3s all deploy from the same chart. The environment is swapped through values files, not by maintaining separate templates for each layer.
That was an important design decision because it means the artifact I test in Kind and K3d is the same artifact that eventually lands in production. Multi-node-specific features, production settings, hostnames, TLS configuration, replica counts, and similar things are controlled through values files. The chart itself remains the same.
Why do I keep a separate experimental multi-node Kind cluster instead of deploying the real production environment as a multi-node cluster?
I simply do not have the resources to run a multi-node cluster in production. But with Kind, I can simulate nodes locally because Kind uses Docker containers as Kubernetes nodes. That allows me to practice handling a multi-node cluster and experiment with things that would otherwise require multiple real machines.
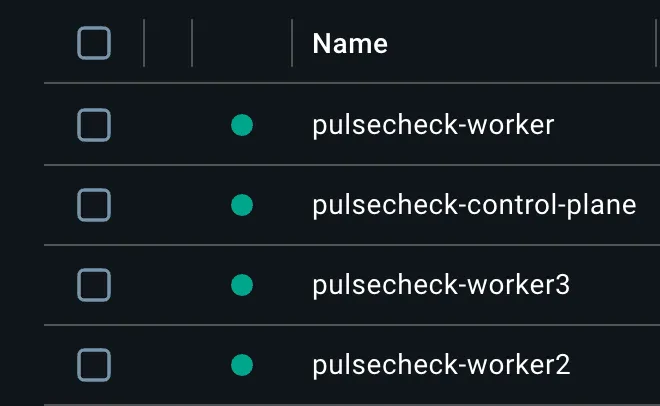
Here, I built a 4-node cluster with Kind.
 cluster nodes
The control-plane is the brain of the cluster. I limited it only to its essential components. That’s how it is supposed to be anyway. Additionally, there are 3 worker nodes. One is dedicated to the Ingress controller, and the other two are for app pods.
Previously, I had handled the Ingress controller inside the control-plane. But then I thought about the security implications and other disadvantages that could come with that, so I moved it to a dedicated worker node. That became the front-facing node, and it routes all the traffic.
That’s how I ended up with 3 worker nodes. Otherwise, I would have only had 2 worker nodes, and the Ingress controller would have been mixed with control-plane node.
I used ingress-nginx inside the worker node that I dedicated to the Ingress controller. It is
standard, well-documented, and has great community support. That’s why I selected it.
I could have selected Traefik as well. That’s what comes by default with K3s, which is the
Kubernetes environment that I’m going to set up on the VPS. But ingress-nginx was my preferred
choice. Maybe this could change later, but currently that’s what I’m using, and that’s what I’m
planning to use in production as well.
While I was testing the cluster with Kind, the most memorable rabbit hole was a silent cluster
bring-up failure. I had labelled the edge worker node-role.kubernetes.io/edge= because that’s the
convention kubectl get nodes uses for the ROLES column. Kind happily started all four
containers, but kubectl get nodes showed only three. Digging into journalctl -u kubelet inside
the failing container revealed that the kubelet was crash-looping with a label-validation error: the
NodeRestriction admission plugin (enabled by default in kubeadm clusters) refuses to let kubelets
self-assign labels in the kubernetes.io/* namespace. That restriction exists for a good reason: a
compromised worker shouldn’t be able to relabel itself as a control-plane node and attract sensitive
workloads.
Lesson: Kubernetes defaults are security-conservative by design, and the right move is to work with
them. I switched to a custom role=edge key for both the label and taint, which matched the
project’s “use restricted-namespace features only when justified” stance.
This is worth remembering. CoreDNS landed on the control plane by default; I patched it onto the app
workers with hostname anti-affinity so a single node failure can’t take out cluster DNS.
NetworkPolicies were rewritten from “open by default with restrictions” to “default-deny everything,
then allow exactly what’s needed” (frontend <-> api, api <-> postgres+redis,
worker <-> postgres+redis+external HTTP/HTTPS). Pod security got the full treatment: non-root,
drop-all-capabilities, no-privilege-escalation, seccomp: RuntimeDefault, and a read-only root
filesystem with explicit emptyDir for the few writable paths. Making this work required
retrofitting the Dockerfiles to add a non-root app user and switching the frontend to
nginx-unprivileged on port 8080, which is one of those “only became necessary once Kubernetes
started enforcing it” changes that I’d otherwise have skipped.
The other most important thing that I should mention here is, I changed the Dockerfiles for api,
worker, and frontend in this sub-iteration to remove root access from containers for security.
The last time I had made changes to those Dockerfiles was in the
9th sub-iteration
Completed tasks under 10th sub-iteration:
- Built a four-node Kind cluster with three logical tiers: a bare control plane that runs only
cluster-management components, two app workers (
role=app) that host application pods, and one dedicated edge worker (role=edge) reserved for the ingress controller via arole=edge:NoScheduletaint - Used custom
role=labels and taint keys instead of thenode-role.kubernetes.io/edgenamespace, after discovering that theNodeRestrictionadmission plugin blocks kubelets from self-assigning labels underkubernetes.io/*at registration time. Sidestepped the restriction without disabling a default security control - Bound the Kubernetes API server to
127.0.0.1so the cluster is unreachable from the LAN, and mapped only ports 80 and 443 to localhost on the edge node - Wrote a Helm chart for the full stack (frontend, api, worker, postgres as a StatefulSet with a PersistentVolumeClaim, redis) so the same chart can target Kind locally and K3s in production with only a values override
- Applied a strict pod security baseline across every workload:
runAsNonRoot, drop ALL Linux capabilities, no privilege escalation, seccompRuntimeDefault, andreadOnlyRootFilesystemwithemptyDirmounts for the few writable paths each container actually needs - Updated the production Dockerfiles to support the new pod security context. The api and worker
images now create an unprivileged
appuser (uid 1000) and run as that user; the frontend switched fromnginx:alpinetonginxinc/nginx-unprivileged:alpine, which listens on 8080 instead of port 80 since unprivileged users cannot bind to ports below 1024 - Defined explicit resource
requestsandlimitson every container so the scheduler can reason about capacity and a misbehaving pod cannot starve its neighbours - Pulled all secrets (postgres password, JWT signing key, OAuth client secrets, derived
DATABASE_URLandREDIS_URL) out of values and into a KubernetesSecret, consumed by pods throughsecretKeyRefandenvFrom. Real values live in a gitignoredvalues-secrets.yamlfile alongside an example placeholder - Replaced the previous “open by default” NetworkPolicies with a default-deny baseline (Ingress and Egress) at namespace scope, then layered minimum-required allow rules on top: frontend↔api, api↔postgres+redis, worker↔postgres+redis, plus DNS egress for everything and external HTTP/HTTPS egress for the worker (private CIDRs excluded so it cannot bypass the policy by hitting cluster IPs directly)
- Installed ingress-nginx via Helm pinned to the edge worker through
nodeSelector: ingress-ready=trueand a toleration forrole=edge:NoSchedule, with the default control-plane toleration removed. Bound the controller to host ports 80 and 443 so Kind’s port mapping forwards browser traffic into the cluster without a NodePort or LoadBalancer - Rescheduled CoreDNS off the control plane onto the app workers using
nodeSelector: role=appand pod anti-affinity by hostname, so the two replicas always run on different app workers and a single node failure cannot take out cluster DNS - Added liveness and readiness probes to api, frontend, postgres (via
pg_isready), and redis (viaredis-cli ping). Worker probes deferred to sub-iter 11 since the worker exposes no HTTP endpoint and a process-level probe belongs with the broader production hardening work - Verified the full path end-to-end: app pods landed on the two app workers, the edge node ran
only ingress-nginx, the control plane ran only core components, service-to-service DNS
resolved, and
curlagainstpulsecheck.localthrough127.0.0.1returned 200 for the static frontend, the nginx healthcheck, and/api/healthproxied to the api pod
Sub-Iteration 11: Local Kubernetes Operations with kind (multi-node showcase)
This sub-iteration is the second part of the previous sub-iteration. Here, I played with some operational configurations of the multi-node cluster as if I were preparing it for production, even though the real production environment for PulseCheck is a single-node cluster.
It’s hypothetical. If I were to deploy PulseCheck in this multi-node cluster in production, I would have handled it this way.
I fixed couple of issues here.
I got hit by a race-condition issue. On a fresh Helm install, the api and worker pods showed 2-4 restarts during cold start. Frontend, postgres, and redis didn’t.
The reason is that helm install submits every pod to Kubernetes at once, and they all start in
parallel. Postgres needs about 10-15 seconds to finish initialization and start accepting
connections on port 5432.
During that window, the api and worker (which both open database connections at startup) try to
connect, get connection refused, raise an exception, and crash. Kubernetes restarts the crashed
container; if postgres still is not ready, the new container crashes too.
The loop continues for two to four cycles until postgres becomes ready. From that point onward, the pods run fine, but the restart count stays as a permanent record of the rough startup.
Frontend doesn’t have this problem because Nginx serves static files and never connects to the database. Postgres and redis don’t have this problem because they are not waiting on anything.
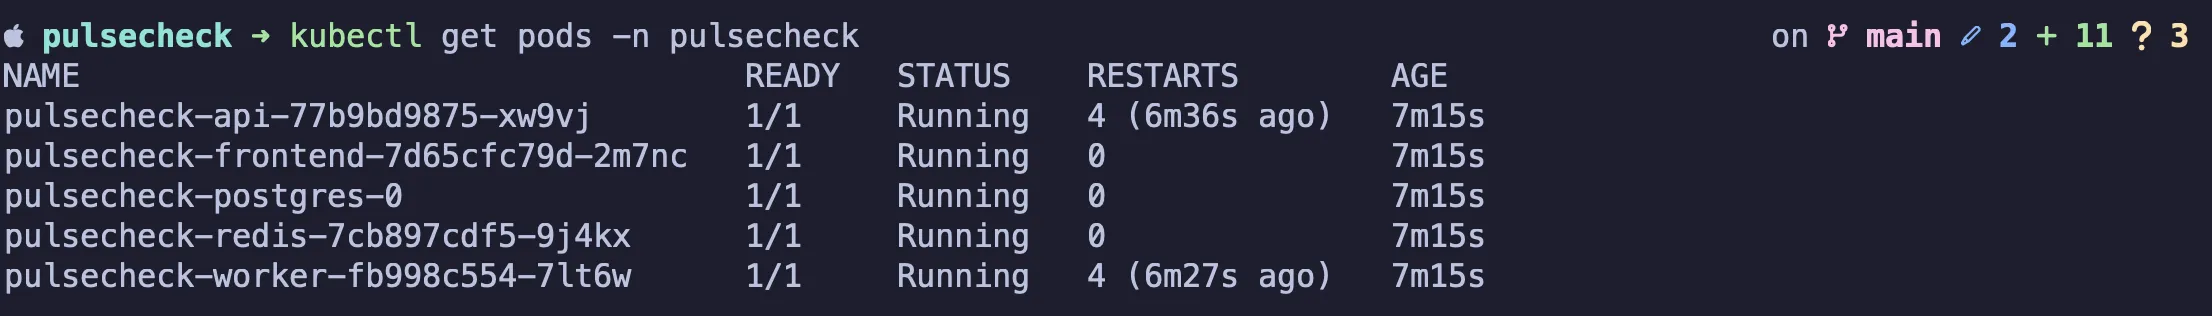 Restarting Pods
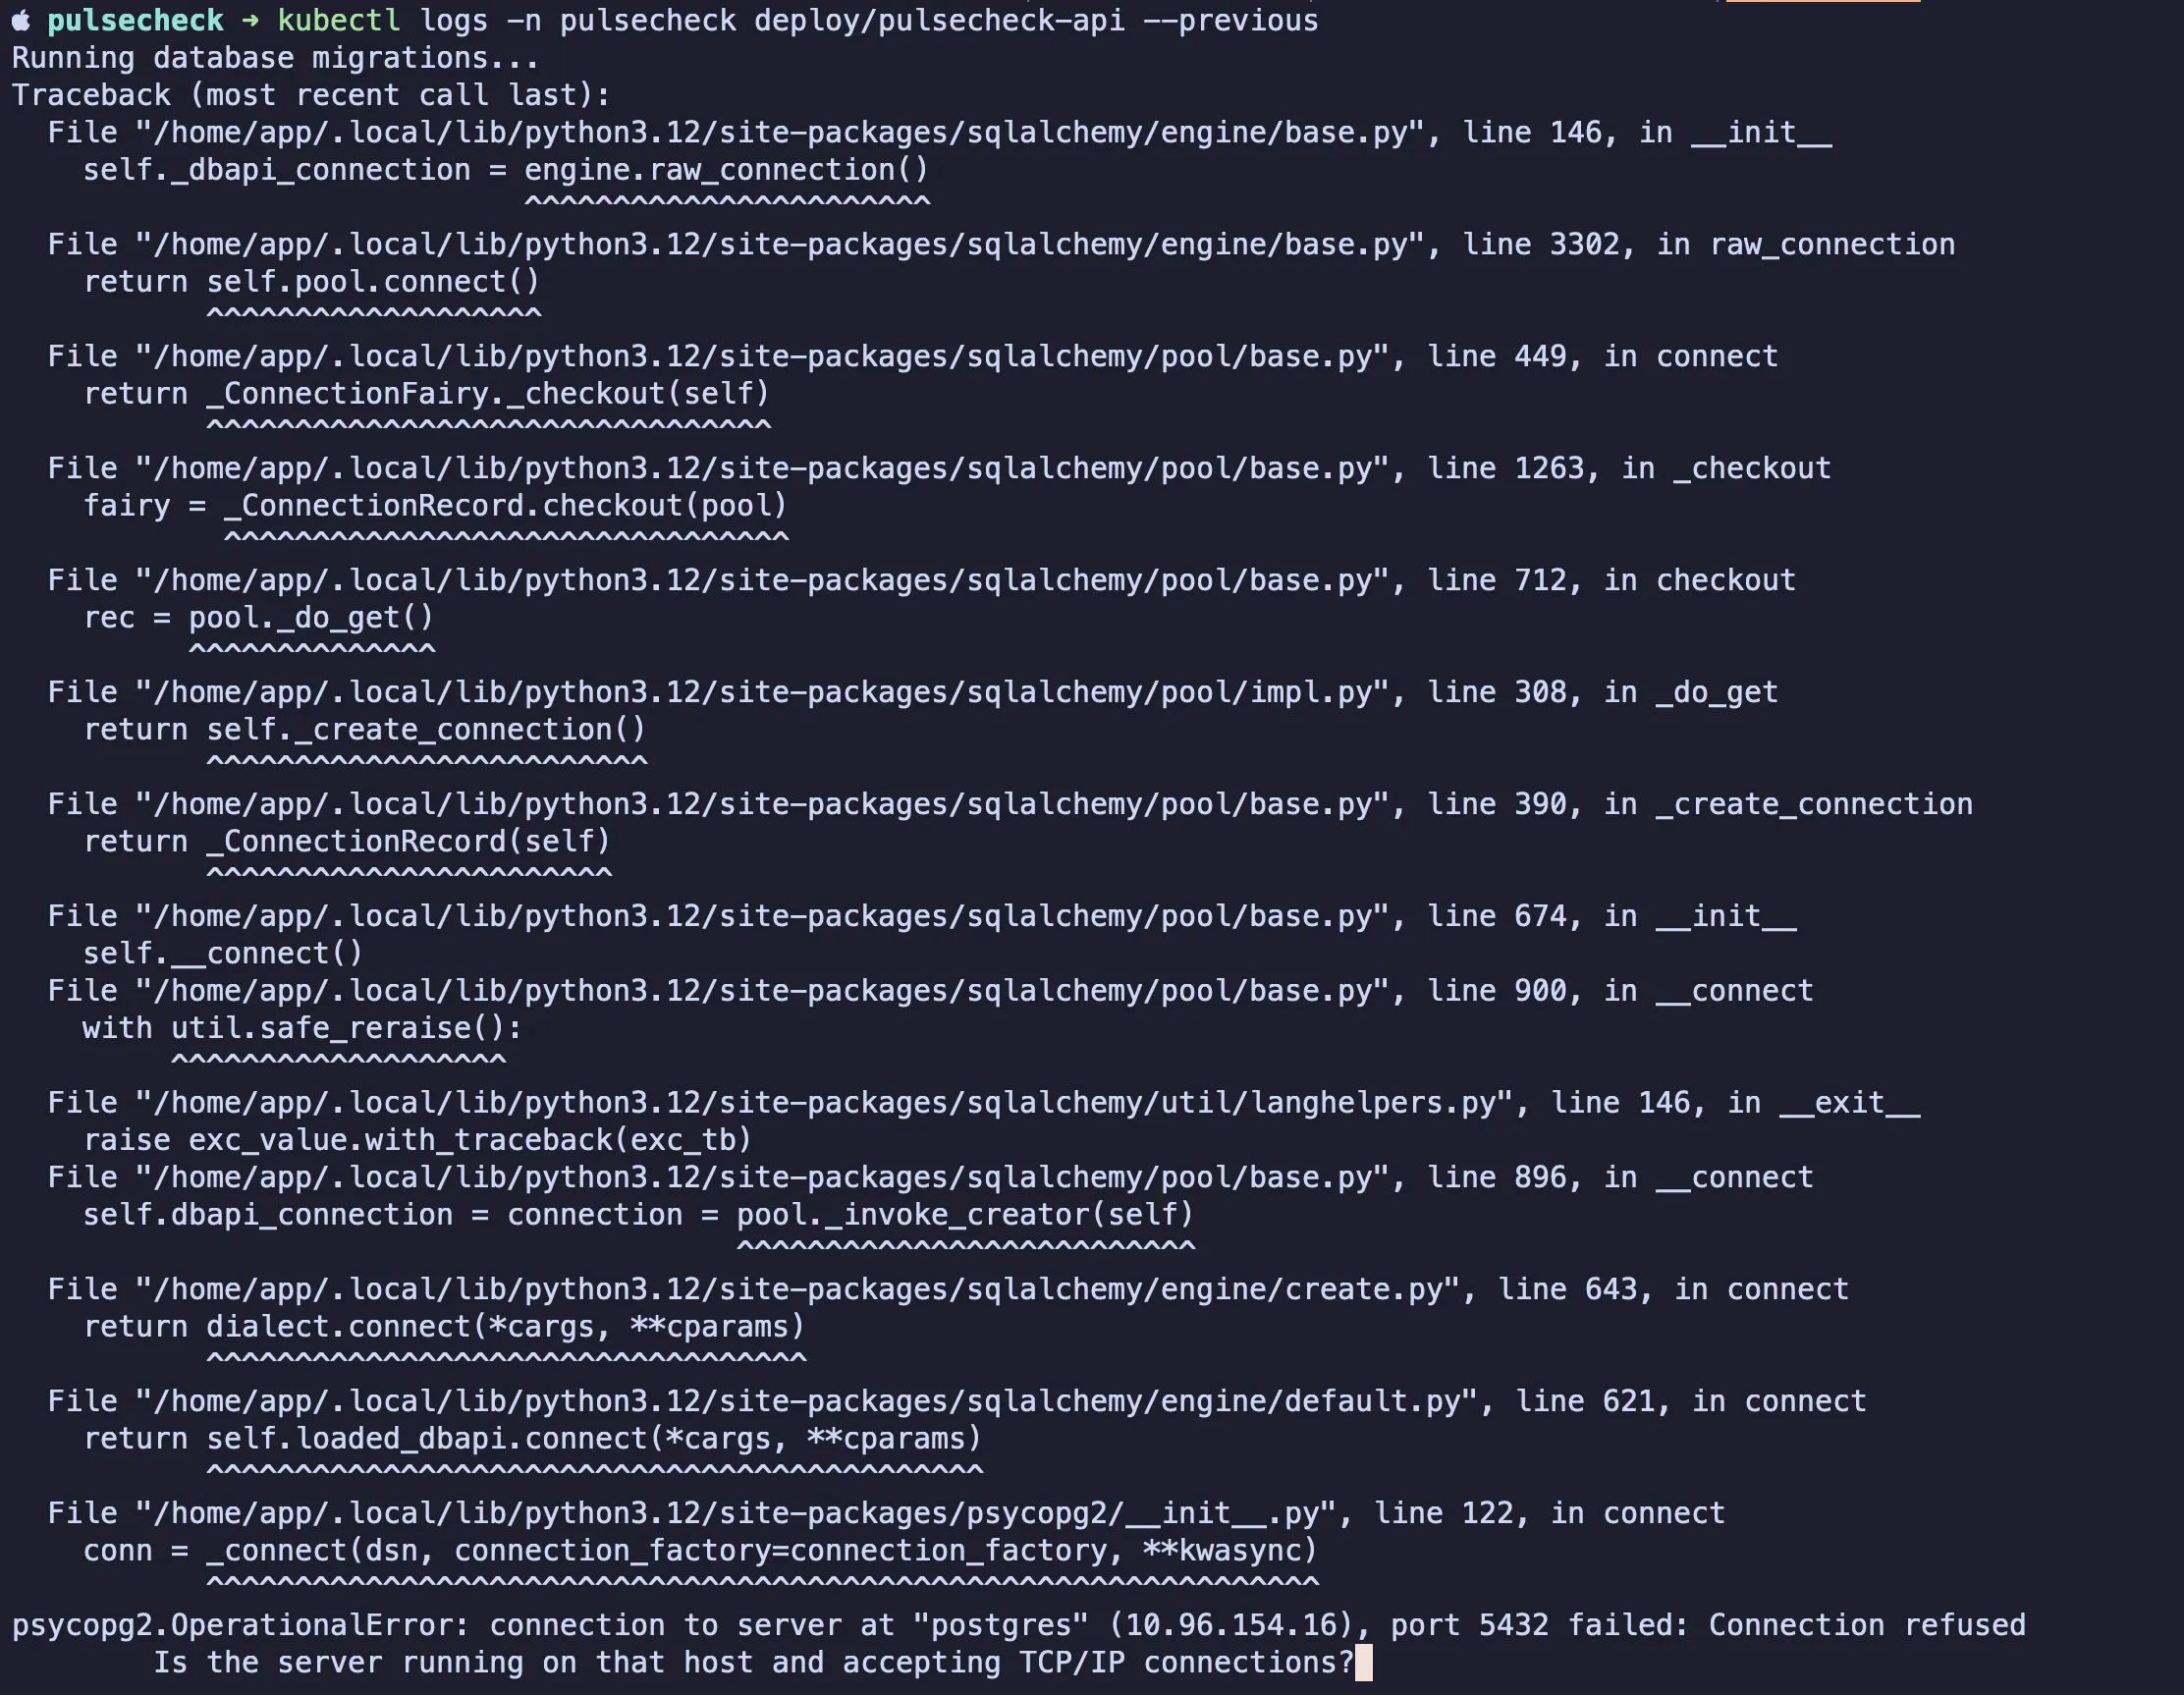 Error logs in API pod
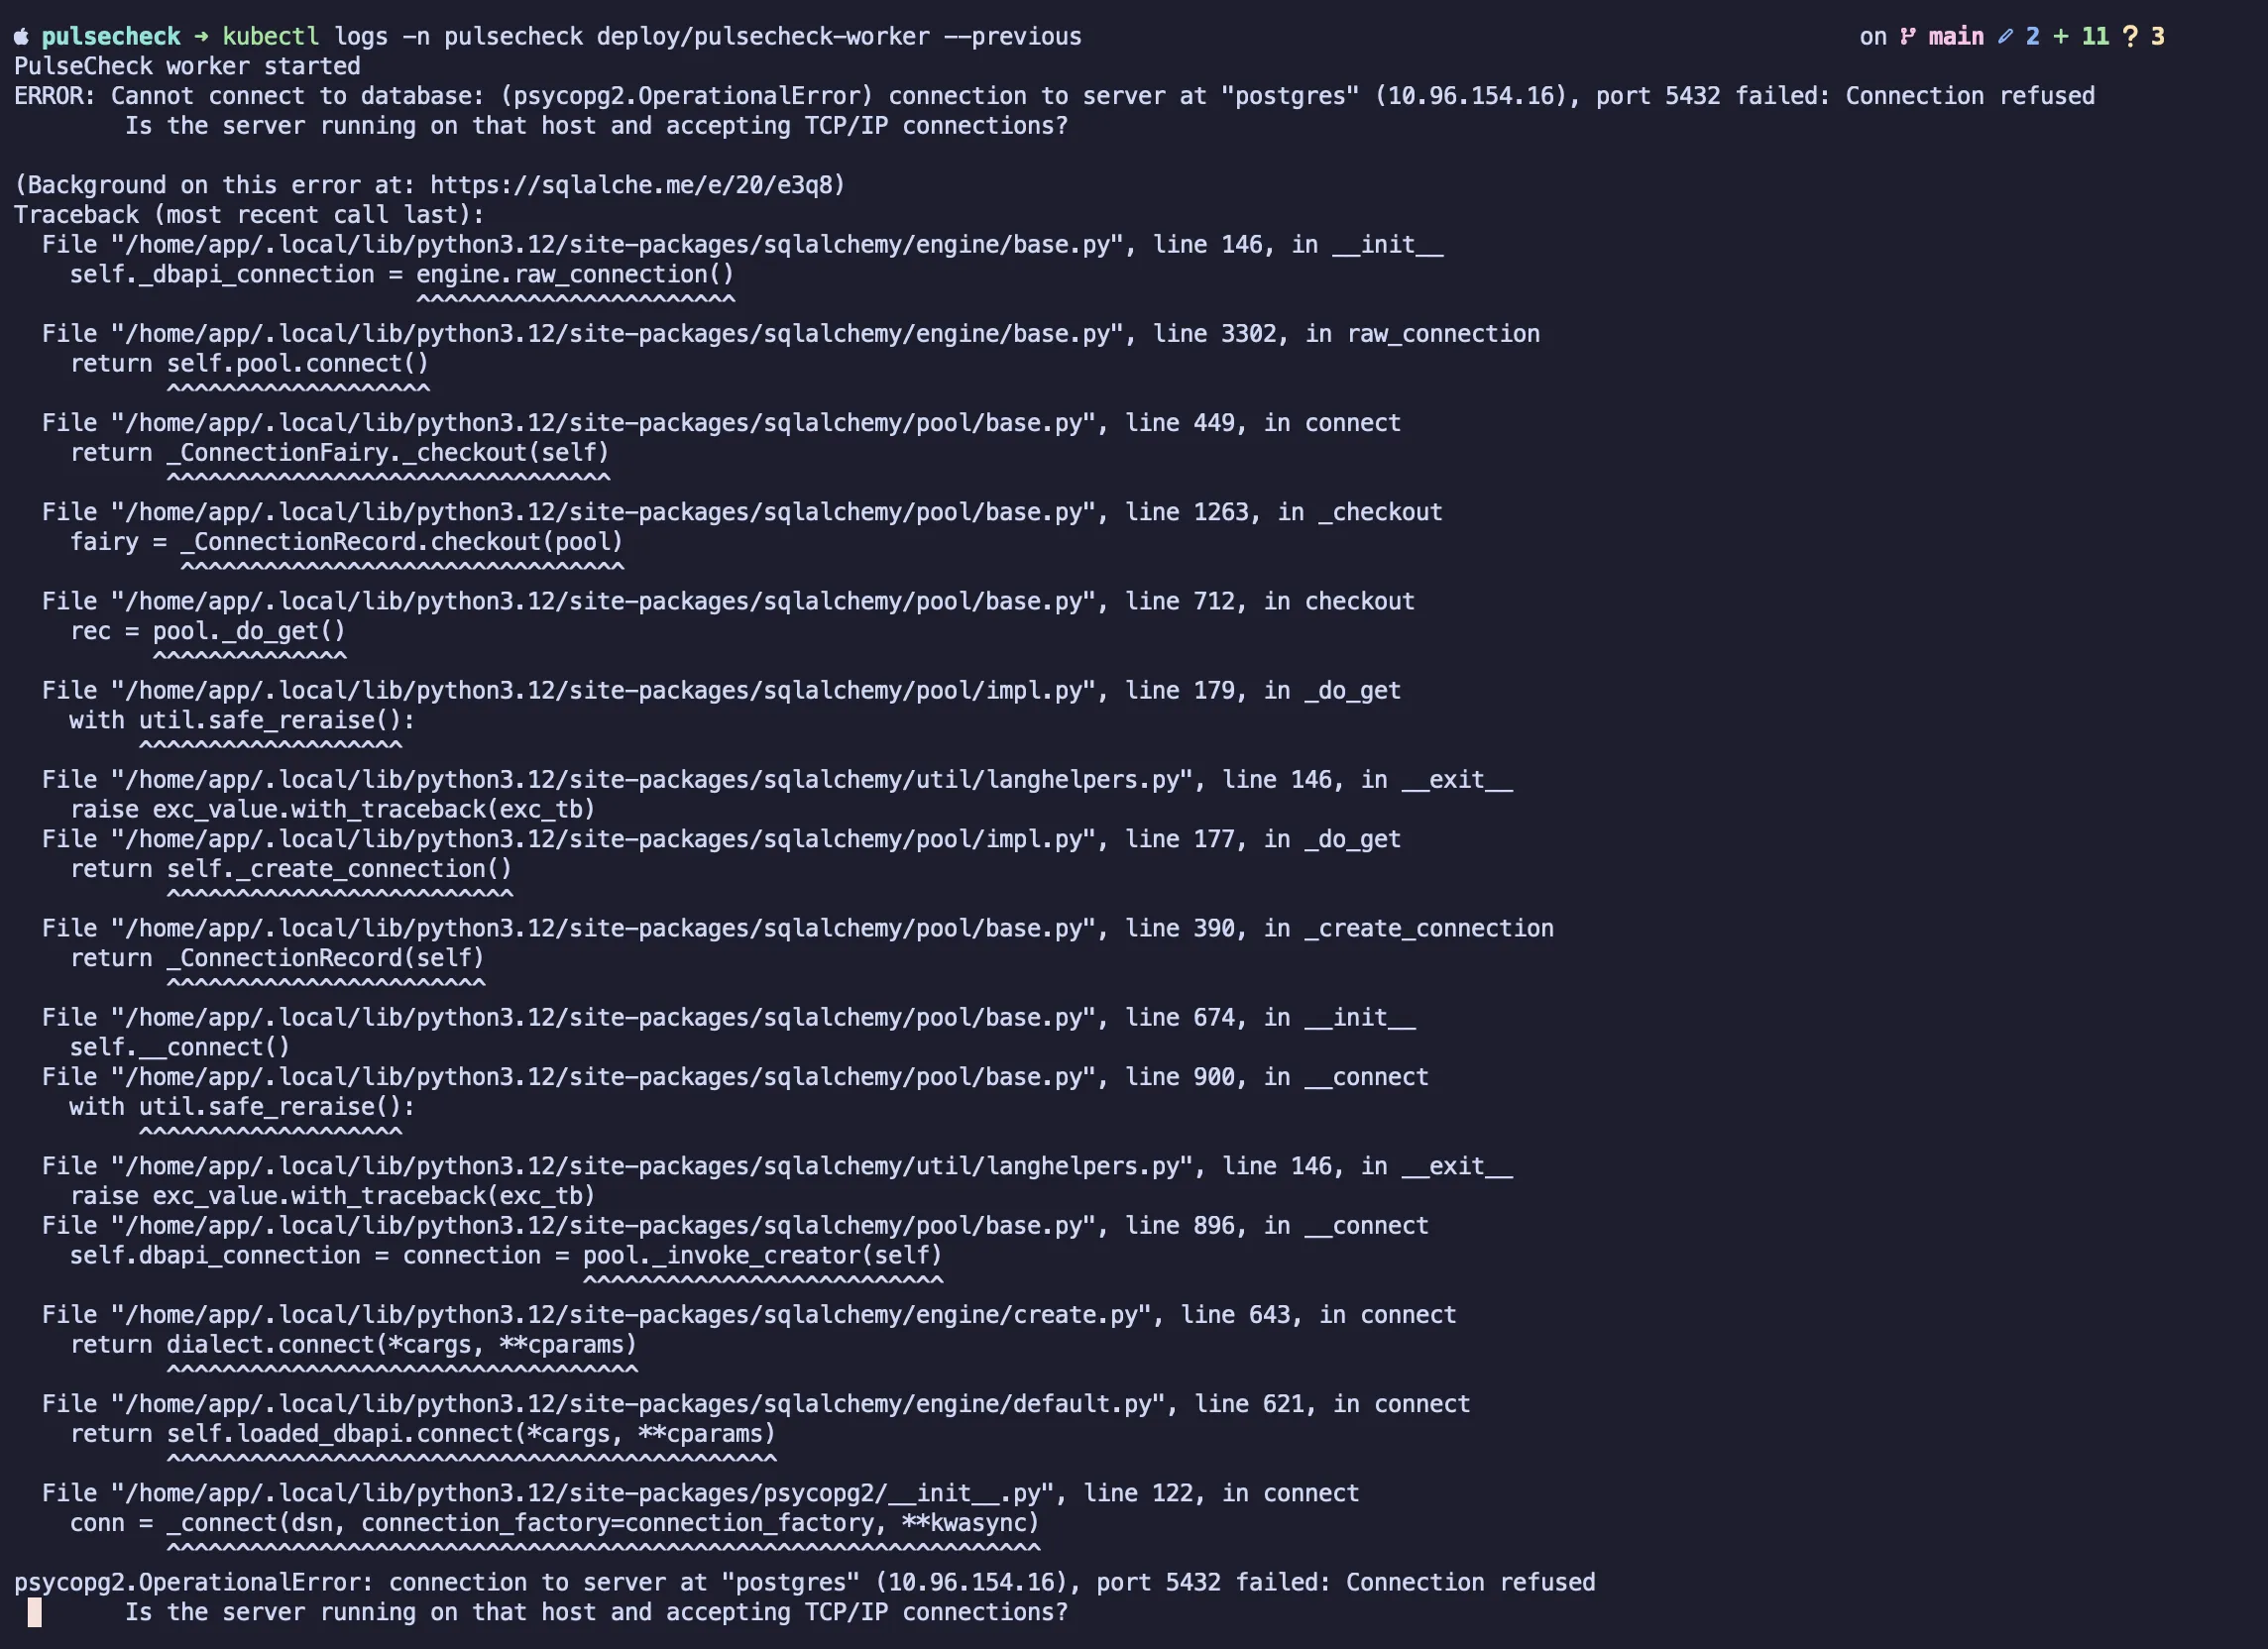 Error logs in worker pod
As the fix, I added init containers to the api and worker pods. An init container is a container
that Kubernetes runs before the main container, and the main container is not started until every
init container has exited with status 0. That’s exactly the gating behavior this race condition
needed.
Each of the two affected pods got two init containers:
wait-for-postgresrunsuntil pg_isready -h postgres ...; do sleep 2; doneusing the postgres imagewait-for-redisruns the same loop pattern withredis-cli -h redis pingusing the redis image
By the time the main api or worker container starts, both pg_isready and redis-cli ping have
already returned successfully, so the application’s first DB connection succeeds immediately and the
pod never crashes.
Frontend, postgres, and redis don’t get init containers because they don’t have startup dependencies.
The wait-for-redis container on the api and worker is defensive. Redis comes up in about two
seconds, so the race rarely happens for redis in practice, but keeping the same gating pattern for
both dependencies makes things consistent.
Init containers inherit the pod’s existing non-root security context, so no special hardening was needed.
After the fix, a fresh make cluster-down && make cluster-up shows every pod at RESTARTS: 0 on
the first try.
After the fix:
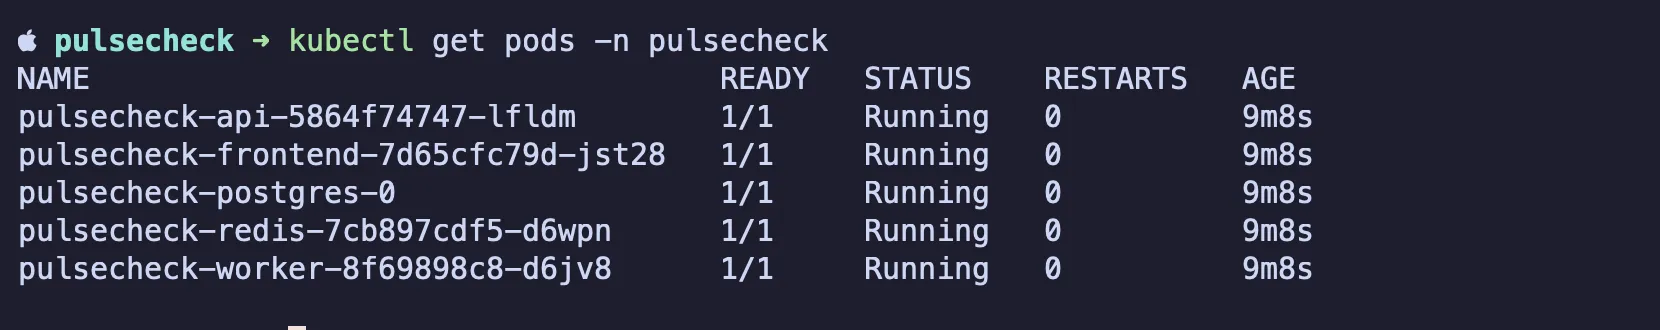 Output after the
fix
Output after the
fix
I fixed the uneven pod spread across the two worker nodes that I dedicated for app pods.
I have two worker nodes dedicated for app pods, but the app pods had not been spread evenly across the workers. I had 5 pods in total. One worker node had 4 pods, while the other worker node had only 1 pod.
I fixed that with topologySpreadConstraints, and I added maxSkew: 1.
The trick was using a shared labelSelector across all my chart’s pods, because the Kubernetes
scheduler only spreads replicas within the same ReplicaSet by default. With the shared selector, the
constraint applies across all my workloads together:
topologySpreadConstraints:
  - maxSkew: 1
    topologyKey: kubernetes.io/hostname
    whenUnsatisfiable: ScheduleAnyway
    labelSelector:
      matchLabels:
        app.kubernetes.io/instance: { { .Release.Name } }
added to all five workload templates. after rolling the deployments, the 4-1 became 2-3 (postgres stays pinned to its node by its PVC, but the other four pods balanced across both app workers).
The other major thing that I handled in this sub-iteration was the worker liveness/readiness probe. The other four containers already had liveness and readiness probes from sub-iteration 10:
- api — HTTP probe on
/api/health - frontend — HTTP probe on
/health(nginx endpoint) - postgres — exec probe running
pg_isready - redis — exec probe running
redis-cli ping
The worker was the only one left without probes because the worker didn’t have an HTTP endpoint to probe. The other four containers all had a natural surface to probe.
I had a few ways to achieve this.
I could have added an in-process HTTP server just to give probes something to hit. But I thought I didn’t want the complexity of adding new code, a new port, and all that.
I went with the simplest answer. The simpler answer was a heartbeat file.
The worker code defines HEARTBEAT_FILE = Path("/tmp/healthy") and calls HEARTBEAT_FILE.touch()
once before the loop starts and again at the end of each tick. That updates the file’s mtime every
~10 seconds (TICK_INTERVAL).
The probe on the container side runs:
[ $(($(date +%s) - $(stat -c %Y /tmp/healthy 2>/dev/null || echo 0))) -lt N ]which is just “current epoch minus the file’s mtime epoch, is that less than N seconds.”
Liveness uses N=60, and readiness uses N=30.
If the worker is alive and looping, the file is always fresh, and the probe exits 0. If the loop
hangs or the file stops updating, the diff grows past the threshold, the probe exits non-zero, and
Kubernetes restarts the container (liveness) or marks it not-ready (readiness).
/tmp is already an emptyDir mount because of readOnlyRootFilesystem: true, so no extra volume
work was needed.
So, three lines of Python, twelve lines of YAML, and no new server.
The HPA work (handling horizontal pod autoscaling) was also one of the interesting parts that I had
within this sub-iteration. Kind doesn’t come with metrics-server. Without metrics, there is no way
horizontal pod autoscaling would work. It’s like trying to handle HPA without the trigger.
metrics-server is what does the CPU reading and triggers the signal when it meets its limits. So I
had to add a Helm install step for metrics-server into the cluster bootstrap before I could write
the HPA template.
Then I added the HPA, generated synthetic load against /api/health with ab, and tested replicas
scaling from one to two to three in real time. They also got spread across both app workers thanks
to the topology constraint.
After the load stopped, the five-minute stabilization window held, then the HPA scaled down one pod per minute exactly as configured.
So it worked out in this multi-node Kind cluster. But in the real single-node production environment, HPA will essentially never fire because traffic is tiny and there is only one node. So it is mostly here for the showcase, as I mentioned.
I usually like to automate things. I wrote some Makefile automation to cover most of the repetitive things in the cluster, which made things easier.
This Makefile is intentionally scoped only to this multi-node Kind cluster. I will create separate
automation for the local production cluster with K3d and the real production cluster with K3s in
sub-iteration 12 under Makefile.prod.
I also completed some other minor things in this sub-iteration.
Completed tasks under 11th sub-iteration:
- ConfigMap for non-sensitive app configuration (FRONTEND_URL, OAUTH_REDIRECT_BASE_URL) consumed
via
envFrom: configMapReffrom the api and worker Deployments - TopologySpreadConstraints across all app workloads (key
kubernetes.io/hostname,maxSkew: 1,ScheduleAnyway) so pods distribute across the two app workers - Init containers on api and worker pods that wait for postgres (
pg_isready) and redis (redis-cli ping) to be ready before the main container starts, eliminating the startup race -
metrics-serverinstalled in the Kind cluster so HPA can read pod CPU metrics - HorizontalPodAutoscaler for the api Deployment (CPU-based, min 1 / max 3 replicas, 70% target utilization) with custom scale-up and scale-down behavior windows
- HPA scaling behavior verified under synthetic load (api scaled across both app workers, then scaled back down after the stabilization window)
- Drain mechanism exercised on the multi-node Kind cluster: stateless workloads migrated to remaining schedulable nodes; postgres surfaced the local-path PVC node-pinning limitation. True zero-downtime drain not validated because the chart runs single-replica services (scale-appropriate for the single-node K3s production target)
- Cluster bootstrap and cleanup automation via
Makefile(cluster-up, cluster-down, cluster-pause, cluster-resume, build-images, load-images, deploy, redeploy) - Rollout, restart, and redeploy automation surface documented in
README.md - Liveness and readiness probes for the worker (heartbeat-file exec probe: worker touches
/tmp/healthyafter each tick; probe checks file mtime against current time)
Sub-Iteration 12: VPS Deployment with K3s
This was the biggest sub-iteration so far. This is where PulseCheck made the jump from local
Kubernetes environments to a real production deployment on a VPS. That meant preparing the Helm
charts for production (values-production.yaml for the VPS and a smaller
values-production-local.yaml override for K3d testing), hardening the VPS, installing K3s,
layering origin shielding through Cloudflare and the provider firewall, setting up SSH-tunneled
kubectl, refactoring the repository into helm/ and k8s/ directories by command, bootstrapping
cluster infrastructure (ingress-nginx, cert-manager, and Let’s Encrypt), deploying the application,
and verifying HTTPS end to end.
A couple of specific notes.
On the K3s install, I disabled Traefik (ingress-nginx handles routing) and ServiceLB (there is no need for LoadBalancer Services on a single bare-metal node), and opened the kubeconfig for non-root read access:
curl -sfL https://get.k3s.io | sh -s - \
  --disable=traefik \
  --disable=servicelb \
  --write-kubeconfig-mode=644
I also pointed pulsecheck.com at the loopback in /etc/hosts so Google OAuth accepts it (.local
is reserved for mDNS and gets rejected). This was also the first sub-iteration where I grouped the
completed tasks into sections.
Completed tasks under 12th sub-iteration:
Pre-VPS preparation
- Docker images dual-tagged with
appVersionfromChart.yamland the immutable git SHA, pushed to GHCR (ghcr.io/kavindujayarathne/pulsecheck-{frontend,api,worker}) - OCI source label (
org.opencontainers.image.source) added to each prod Dockerfile. Packages linked to the source repo manually (the auto-link does not fire for localdocker push, expected to work for Actions-pushed builds in sub-iter 13) -
helm/pulsecheck/templates/ingress.yamlextended withannotationsandtlsblock support so the production Ingress can carry thecert-manager.io/cluster-issuerannotation and reference the LE-issued Secret -
helm/pulsecheck/templates/postgres-statefulset.yamlgained astorageClassNameconditional onvolumeClaimTemplates, enabling K3s’slocal-pathprovisioner in real-prod and k3d while staying defaulted for Kind -
helm/pulsecheck/values.yamlimage tags changed from"0.1.0"to the sentinel"REPLACED_AT_DEPLOY"so a missing--set <component>.image.tag=...fails loudly instead of silently shipping the old default -
helm/pulsecheck/values.yamlKind ingress host changed frompulsecheck.local(set in sub-iter 10) topulsecheck.comso Google OAuth accepts it (.localis reserved for mDNS and rejected by Google) -
helm/pulsecheck/values-production.yamlcreated as a standalone prod values file: postgres/redis/frontend/api/worker resources, GHCR image refs, ingress with cert-manager + Let’s Encrypt TLS, HPA disabled,storageClassName: local-pathfor K3s -
helm/pulsecheck/values-production-local.yamlcreated as a small override on top ofvalues-production.yamlfor the local-prod testing layer (HTTP only, image refs back to locally-built tags, host reachable viapulsecheck.kavindujayarathne.io:8080) -
helm/pulsecheck/values-secrets-production-local.yamlandhelm/pulsecheck/values-secrets-production.yamlcreated (both gitignored); separate OAuth apps per environment -
.gitignorewidened tohelm/pulsecheck/values-secrets*.yamlso all per-environment secrets files are covered by one rule - Local single-node K3s validated via
k3dandk8s/k3d-config.yaml: k3d binds127.0.0.1:8080, Traefik disabled so ingress-nginx (same controller as real-prod) handles routing, chart installs cleanly, postgres data persists via alocal-pathPVC, all pods Running - Kind layer and local-prod layer coexist on the host: distinct hostnames (
pulsecheck.comfor kind,pulsecheck.kavindujayarathne.iofor k3d) and distinct host ports (kind binds 80, k3d binds 8080) - OAuth app per environment registered (4 total per provider):
pulsecheck-dev(Docker Compose,http://localhost:8000),pulsecheck-kind(Kind,http://pulsecheck.com),pulsecheck-local(k3d local-prod,http://pulsecheck.kavindujayarathne.io:8080),PulseCheck(real VPS,https://pulsecheck.kavindujayarathne.com)
Setting up VPS and K3s install
- Inbound firewall configured to allow only 22 (SSH), 80 (HTTP), 443 (HTTPS), and ICMP from the public internet; all other inbound dropped at the network boundary
- K3s installed via the official installer (
curl -sfL https://get.k3s.io | sh -) with--disable=traefik --disable=servicelb --write-kubeconfig-mode=644. Traefik off so ingress-nginx handles routing; servicelb off because LoadBalancer Services are unused on bare-metal single node; kubeconfig mode644for non-root read
Origin shielding (Cloudflare proxy + VPS provider firewall)
- DNS A record for
pulsecheck.kavindujayarathne.compointed at the VPS and proxied through Cloudflare (orange cloud), so DNS resolves to Cloudflare edge IPs rather than the origin - VPS provider firewall inbound rules for TCP 80 and TCP 443 narrowed to Cloudflare’s published IPv4 + IPv6 ranges (15 v4 + 7 v6 CIDRs from https://www.cloudflare.com/ips-v4 and ips-v6)
- Cloudflare SSL/TLS mode initially set to Flexible during cert-manager bootstrap, then switched
to Full (strict) once the Let’s Encrypt cert was issued.
Always Use HTTPSenabled afterward - Origin shielding verified: direct
nc -zv -w 10 <vps-ip> 443from a non-Cloudflare source times out, while the same probe via Cloudflare succeeds
Remote cluster access
- Set up SSH local-port-forward tunnel for laptop
kubectlaccess, forwarding local port16443over SSH to the cluster API server inside the VPS - Fetched K3s kubeconfig (
/etc/rancher/k3s/k3s.yaml) viascpto the laptop as~/.kube/pulsecheck-prod.yaml(chmod 600), with the server URL rewritten tohttps://127.0.0.1:16443 - Kept the prod kubeconfig separate from
~/.kube/config; reaching prod requires an explicitKUBECONFIG=~/.kube/pulsecheck-prod.yaml
Repo structure refactor
- Adopted rule that
helm/holds anything consumed byhelm install -fandk8s/holds cluster-creation tool configs plus raw manifests applied viakubectl apply -f(split by command, not by topic) - Moved
k8s/ingress-nginx-values.yamltohelm/ingress-nginx/values-kind.yamlviagit mv - Created per-chart subdirectories under
helm/(helm/ingress-nginx/,helm/cert-manager/) so each upstream chart’s values stay isolated from the user-authoredhelm/pulsecheck/chart package - Updated path references in
Makefile(INGRESS_VALUES) andREADME.md(Project Structure section)
Cluster infrastructure (bootstrap)
- Created
helm/ingress-nginx/values-production.yaml: hostPort 80/443 binding (no LoadBalancer on bare-metal single node), CF-Connecting-IP trust viareal-ip-header+proxy-real-ip-cidrpopulated with the same Cloudflare CIDRs the VPS provider firewall uses, single replica, resource limits - Created
helm/cert-manager/values.yaml:crds.enabled: trueso the chart installs the CRDs, single replica per component (controller, webhook, cainjector, startupapicheck), resource limits - Created
k8s/cert-manager/clusterissuer.yamlwith two ClusterIssuers (letsencrypt-stagingandletsencrypt-prod) using the HTTP-01 solver via the nginx ingress class - Added
bootstrap-prodtarget inMakefile.prodthat runs the one-time cluster infrastructure install (helm install ingress-nginx + helm install cert-manager + kubectl apply ClusterIssuers); safe to re-run viahelm upgrade --install - Bootstrap executed against the VPS K3s cluster via
make -f Makefile.prod bootstrap-prod; all components reached Ready
App deployment
- Added
--platform linux/amd64to thebuild-imagestarget inMakefile.prodso GHCR images match the VPS architecture (local-prod-buildleft untouched since it runs on the laptop) - App deployed against the VPS K3s cluster via
make -f Makefile.prod deploy-prod; all pods reached Running 1/1
End-to-end TLS
- Switched Cloudflare SSL/TLS mode from Flexible to Full (strict)
- Enabled Cloudflare
Always Use HTTPS - Verified end-to-end via
curl -v https://pulsecheck.kavindujayarathne.com: HTTP/2 200, response body is the pulsecheck SPA HTML - Verified origin cert via
openssl s_client -connect localhost:443 -servername pulsecheck.kavindujayarathne.com: issuer Let’s Encrypt, subject CN matches the production hostname